 Maradok
Kereskedési feltételek
Products
Eszkozok


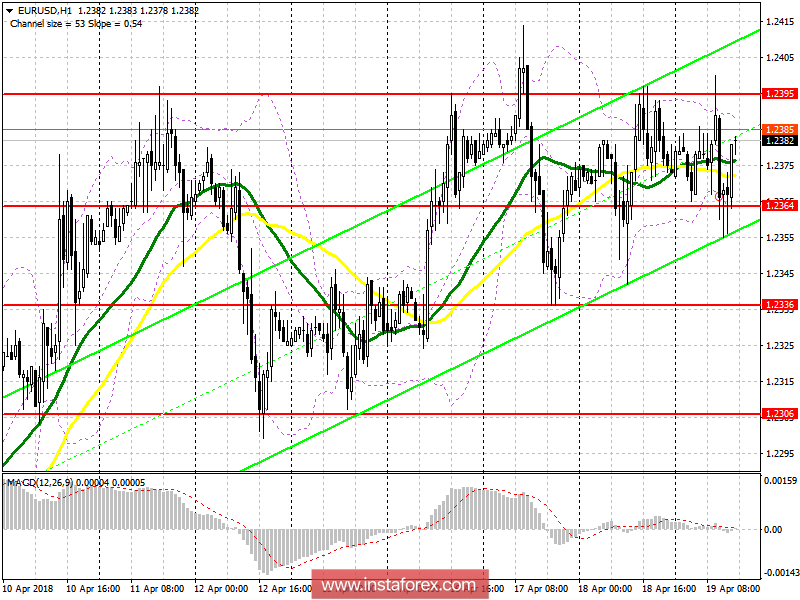
To open long positions for EUR / USD, you need:
Bulls were able to secure the 1.2364 support level in the first half of the day, but their main goal is the breakdown and consolidation at 1.2395 resistance zone, but the level above may indicate the continuation of the upward wave in euro with the updated new highs around 1.2430 and 1.2464, where it is recommended to fix profits. If the single European currency falls back to support level 1.2364, it is better to return to the market after testing the area 1.2336 or to conduct a rebound from 1.2306.
To open short positions for EUR / USD, you need:
Sellers were able to enter the area of 1.2395 but unlikely to reach under 1.2364. The plan remains the same during the first half of the day. After an unsuccessful attempt, sales will consolidate again and return to resistance level 1.2395. The breakout of 1.2364 area will lead to a larger sellout near the lower boundary of 1.2336 channel while testing the area 1.2306, where it is recommended to fix profit. In case of growth above 1.2395, selling the euro may conduct a rebound from 1.2430 and 1.2464.
Indicators description
* The presented market analysis is informative and does not constitute a guide to the transaction.
InstaForex analytical reviews will make you fully aware of market trends! Being an InstaForex client, you are provided with a large number of free services for efficient trading.

