 Maradok
Kereskedési feltételek
Products
Eszkozok


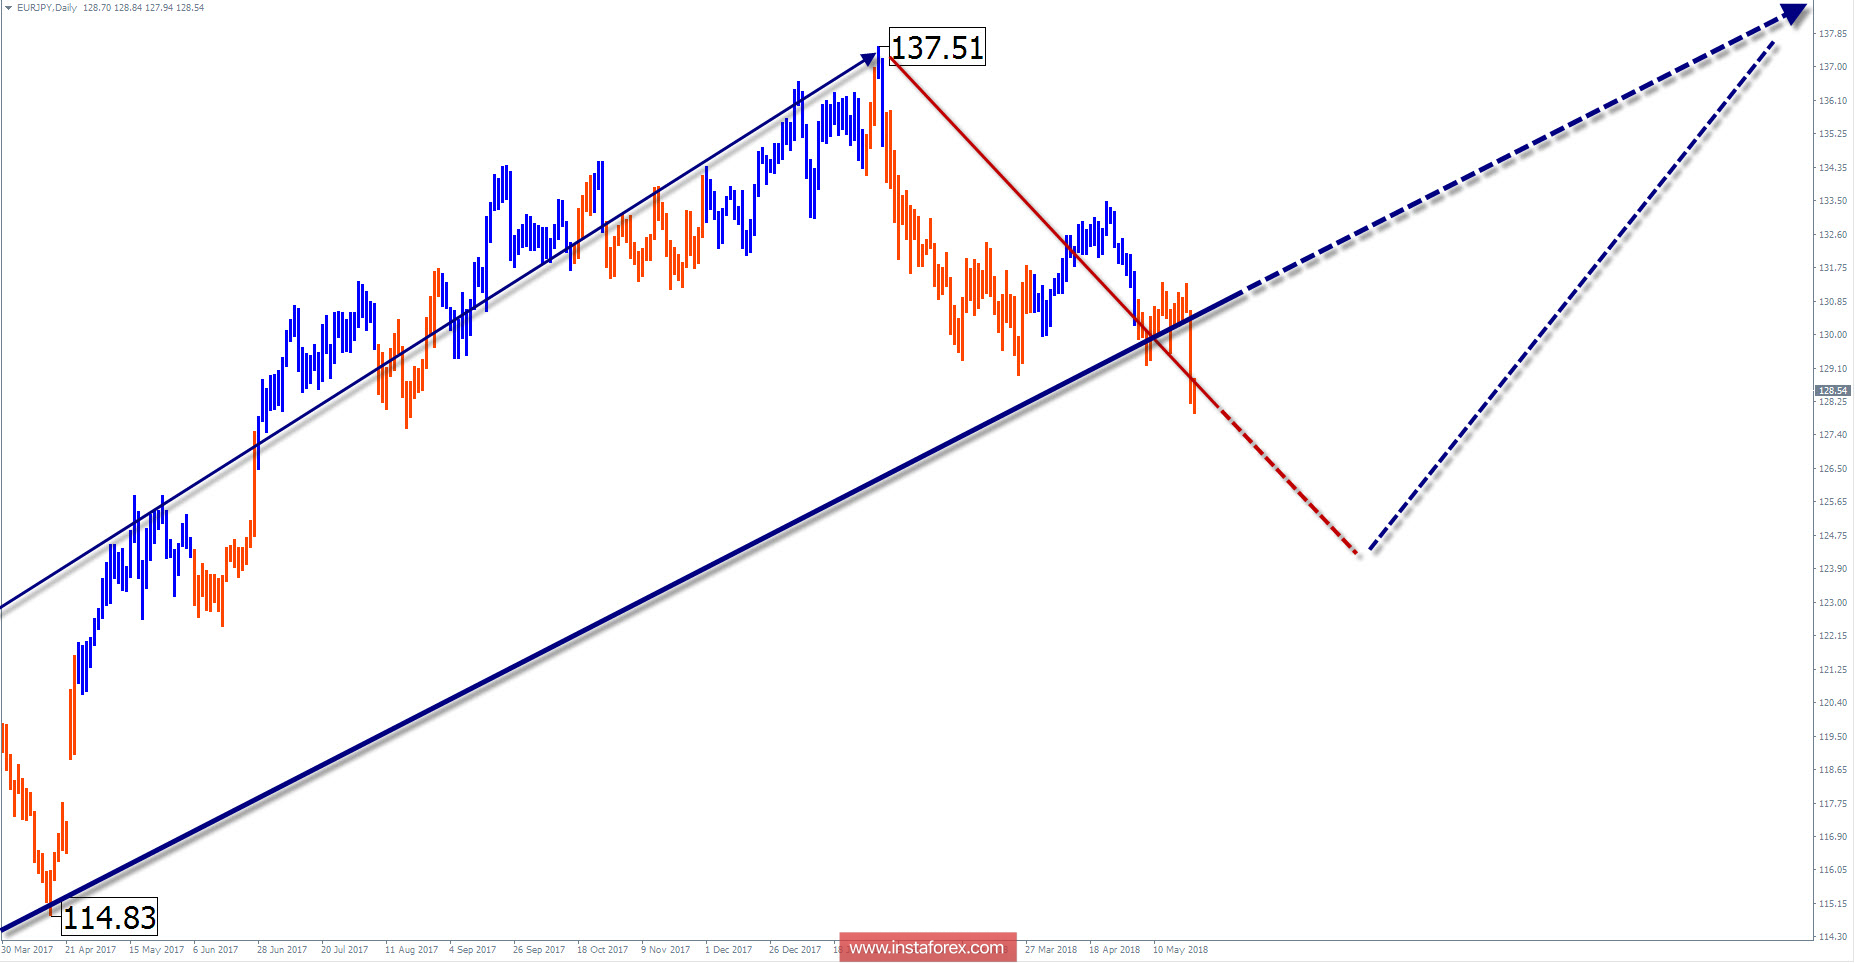
Wave picture of the D1 chart:
Since June 2016, the price trend direction of the EUR/JPY cross pair is set by the rising wave. It is not yet complete with a high wave potential. In recent months, the price has fallen and forms the corrective part of the wave (B).
The wave pattern of the H1 graph:
The current wave of 24 prices completes the descending zigzag of a larger scale chart. The upper boundary of the target reduction target zone is approximately in 4 price figures below the current pair price.
The wave pattern of the M15 chart:
The last section from May 15 is directed towards the main direction of the trend. In the coming days, the pair expects a short-term pullback.
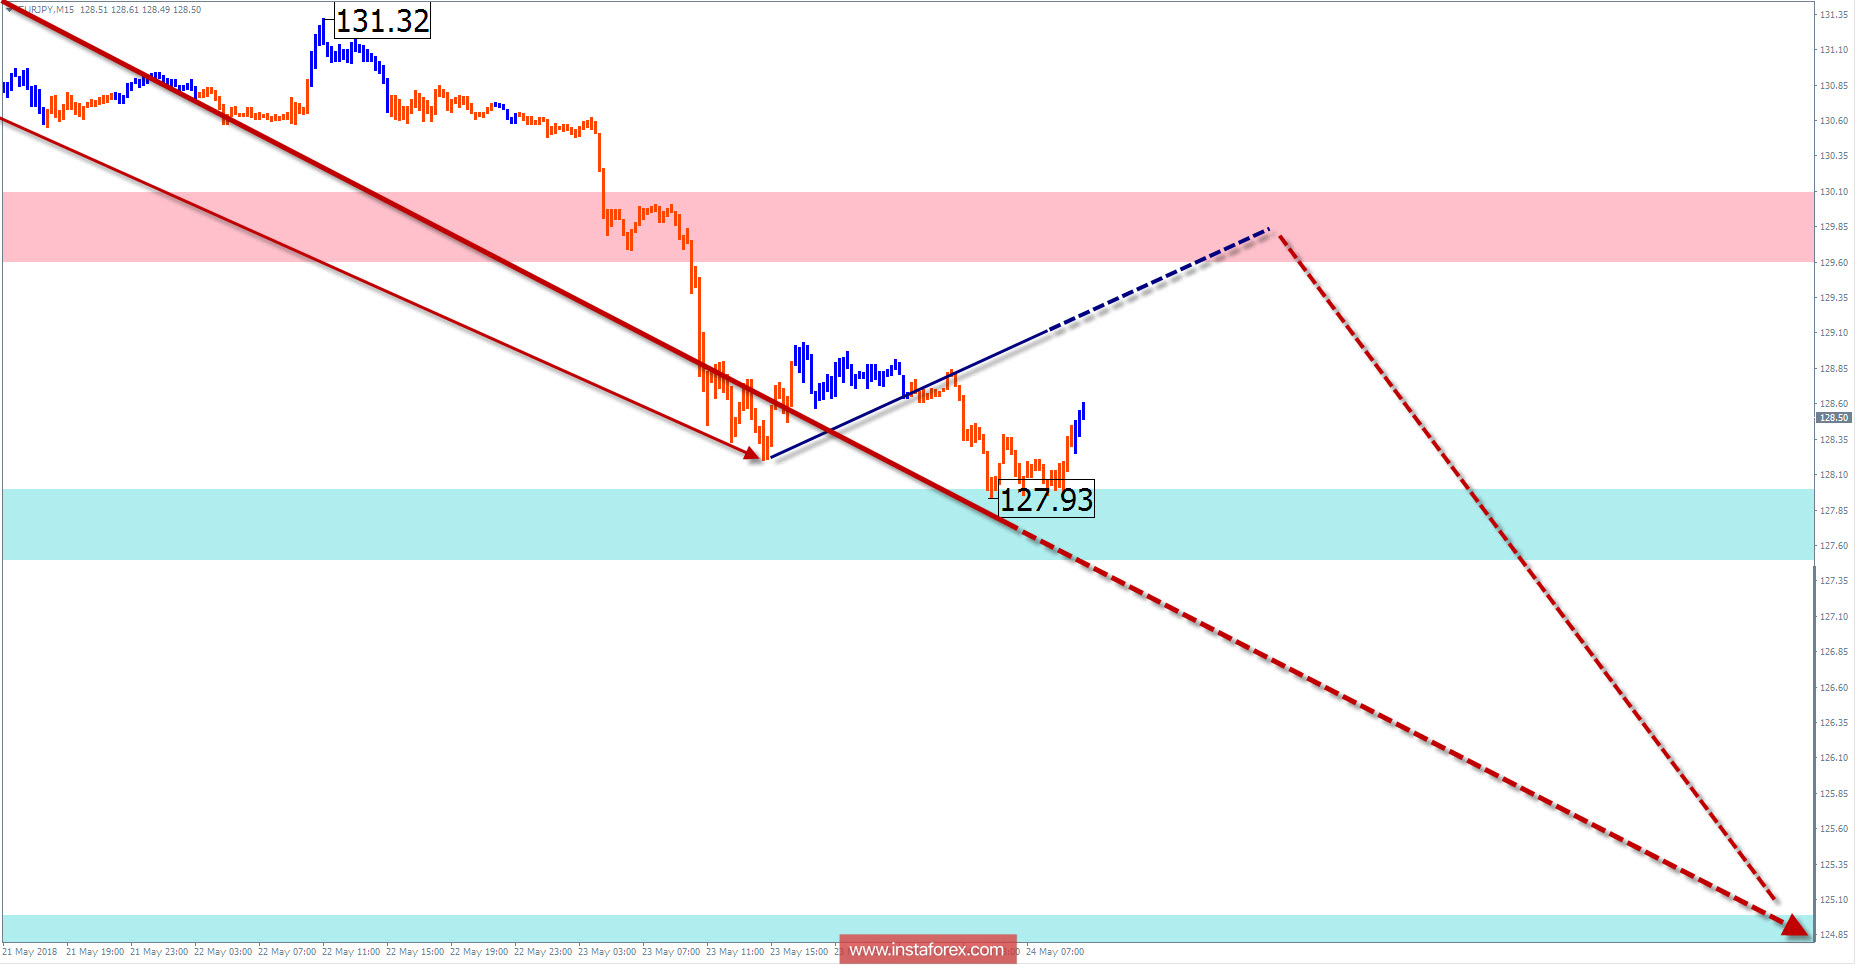
Recommended trading strategy:
Sales are relevant only for short-term types of trading. On a large scale of trading transactions, it is more logical to wait for the completion of the correction and look for purchase signals.
Resistance zones:
- 129.60 / 130.10
Support zones:
- 128.00 / 127.50
- 125.00 / 124.50
Explanations to the figures: Simplified wave analysis uses a simple waveform, in the form of a 3-part zigzag (ABC). Every TF shows that the last incomplete wave is analyzed. Zones show the calculated areas with the greatest probability of a reversal.
Arrows indicate the wave counting according to the technique used by the trader. The solid background shows the generated structure, dotted - the expected wave motion.
Attention: The wave algorithm does not take into account the duration of the tool movements in time. To conduct a trade transaction, you need confirmation signals from your trading systems!
* The presented market analysis is informative and does not constitute a guide to the transaction.
InstaForex analytical reviews will make you fully aware of market trends! Being an InstaForex client, you are provided with a large number of free services for efficient trading.


