 Maradok
Kereskedési feltételek
Products
Eszkozok


4-hour timeframe
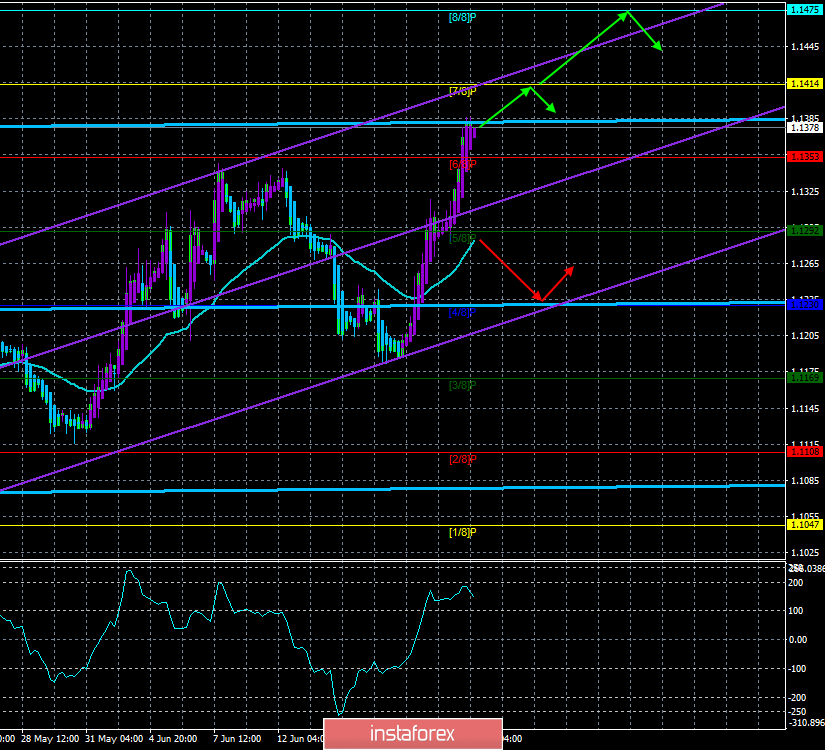
Technical data:
The upper linear regression channel: direction – sideways.
The lower linear regression channel: direction – up.
The moving average (20; smoothed) – up.
CCI: 144.4901
The upward movement of the EUR/USD pair continues. Last Friday, we expected a downward correction, but another set of failed macroeconomic statistics from the US forced traders to continue buying the euro. Thus, the expectations of correction are postponed for today, as today there will be no important publications in the States or in the European Union. A new week for the euro/dollar pair is like life from a clean slate. All the most important events of the month have been left behind, and the bulls need to prove their strength and keep the won positions from the bears without the support of macroeconomic data from overseas. If they succeed, it will be more confident to talk about the formation of an upward long-term trend. However, despite all our expectations, the price is near its maximum values, that is, at the moment, there is no sign of the beginning of the correction. Thus, traders who continue to be in the long positions can hold them until the reversal of the indicator Heiken Ashi down. We still believe that the prospects for the euro are vague, but we respect the bullish sentiment that has emerged in recent weeks.
Nearest support levels:
S1 – 1.1353
S2 – 1.1292
S3 – 1.1230
Nearest resistance levels:
R1 – 1.1414
R2 – 1.1475
R3 – 1.1536
Trading recommendations:
The EUR/USD currency pair continues to move upwards, as evidenced by Heiken Ashi. Thus, it is now recommended to hold long positions with targets at 1.1414 and 1.1475 to the reversal of the Heiken AshiI down.
It is recommended to sell the euro after traders fix the pair below the moving average line, which will change the trend to a downward one, with the first targets of 1.1230 and 1.1200.
In addition to the technical picture should also take into account the fundamental data and the time of their release.
Explanation of illustrations:
The upper linear regression channel – the blue line of the unidirectional movement.
The lower linear regression channel – the purple line of the unidirectional movement.
CCI – the blue line in the indicator window.
The moving average (20; smoothed) is the blue line on the price chart.
Murray levels – multi-colored horizontal stripes.
Heiken Ashi is an indicator that colors bars in blue or purple.
InstaForex analytical reviews will make you fully aware of market trends! Being an InstaForex client, you are provided with a large number of free services for efficient trading.


