 Maradok
Kereskedési feltételek
Products
Eszkozok


Last week, the pair broke away from the resistance line of 1.3207 (the black bold line) and made a downward movement, breaking through the 38.2% retracement level - 1.2925 (the red dotted line). Most likely, the downward movement will continue this week.
Trend analysis:
This week, the price is likely to continue moving downwards, with a goal of reaching a pullback level of 50.0% at 1. 2741 (red dotted line). If this level is reached, there will be a further downward movement, with the goal of 1.2558 and a pullback level of 61.8% (red dotted line).
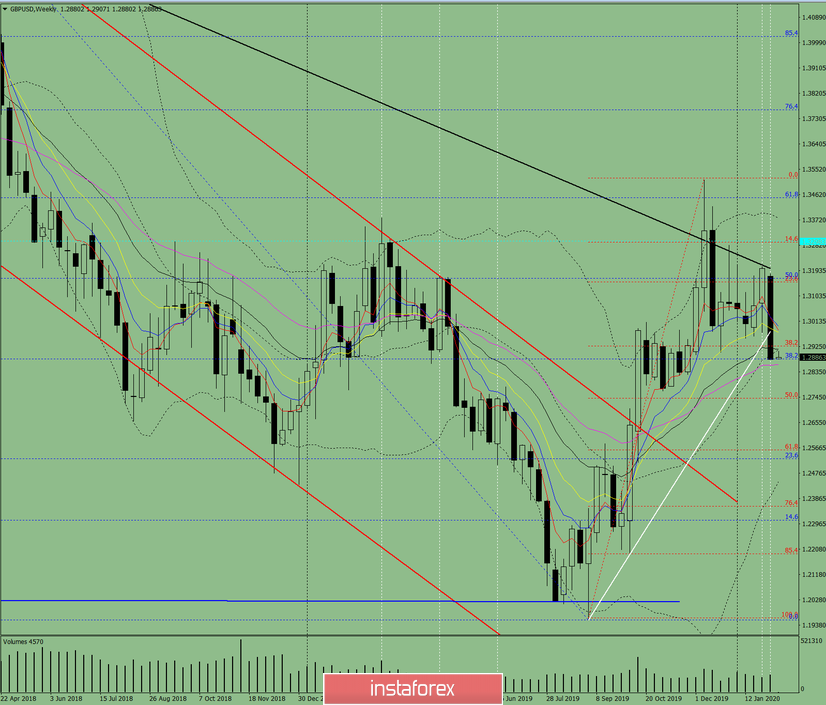
Fig. 1 (weekly chart)
Complex analysis:
- Indicator analysis: down;
- Fibonacci levels: down;
- Volumes: down;
- Candlestick analysis: neutral;
- Trend analysis: down;
- Bollinger bands: down;
- Monthly chart / schedule: down
The complex analysis infers a downward movement.
The overall result of calculating the candle of the GBP / USD currency pair according to the weekly chart: the price of the week is likely to have a downward trend, with the absence of the first upper shadow of the weekly black candlestick (Monday - down ) as well as the absence of the second lower shadow (Friday - down).
The first lower target is 1.2741 and a pullback level of 50.0% (red dotted line).
An unlikely upper scenario is possible: from a pullback level of 38.2% - 1.2880 (blue dotted line), work upwards to the first goal of 1.3166 - a pullback level of 50.0% (blue dotted line).
InstaForex analytical reviews will make you fully aware of market trends! Being an InstaForex client, you are provided with a large number of free services for efficient trading.


