 Maradok
Kereskedési feltételek
Products
Eszkozok


The pair, in accordance with fundamental analysis, continued to move down last week, having already passed 10 figures down. Moving down, the price tested the support line 1.1411 (black bold line). Most likely, the price may start a pullback upward movement this week.
Trend analysis:
This week, the price, having broke through the support line of 1.1411 (black bold line), will move up with the first upper target 1.1831 - a pullback level of 23.6% (blue dashed line), and if this line is reached, it will continue to further develop with a target of 1.2093 - pullback level 38.2% (blue dashed line).
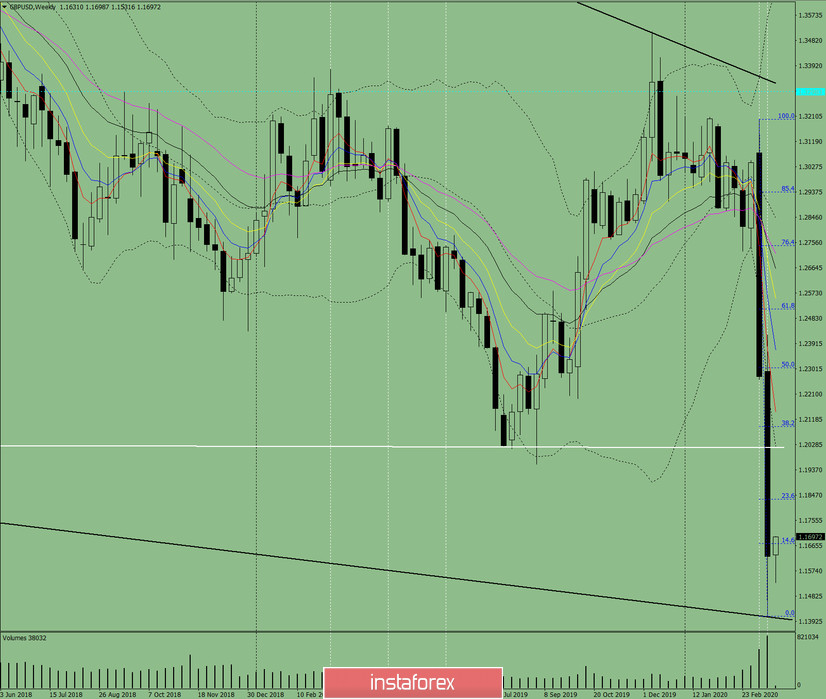
Fig. 1 (weekly schedule).
Comprehensive analysis:
- indicator analysis - up;
- Fibonacci levels - up;
- volumes - down;
- candlestick analysis - up;
- trend analysis - up;
- Bollinger lines - down;
- monthly chart - up.
The conclusion of a comprehensive analysis is an upward movement.
The overall result of calculating the candle of the GBP / USD currency pair according to the weekly chart: the price of the week will most likely have an upward trend with the absence of the first lower shadow of the weekly white candlestick (Monday - up) and the presence of the second upper shadow (Friday - down).
The first upper target of 1.1831 is a pullback level of 23.6% (blue dashed line) and if this line is reached, it will continue to further develop with a target of 1.2093, which is a pullback level of 38.2% (blue dashed line).
The unlikely lower scenario: from the level - 1.1627 (closing the last weekly candle) work down with the first target 1.1404 - support lines (black bold line)
InstaForex analytical reviews will make you fully aware of market trends! Being an InstaForex client, you are provided with a large number of free services for efficient trading.


