 Maradok
Kereskedési feltételek
Products
Eszkozok


Hello!
Today, we will have a closer look at the dollar/franc pair, another major currency pair on Forex. The pair is quite interesting and has a clear technical picture. I suggest we observe the pair starting from a weekly time frame.
Weekly time frame
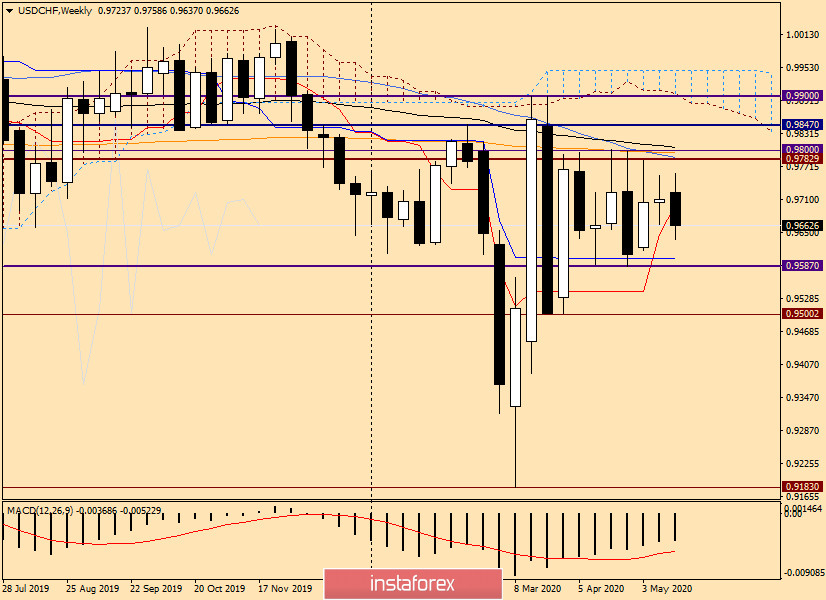
Last week, bulls failed to resume the uptrend on USD/CHF which resulted in the formation of the doji candlestick called the rickshaw man. Although this candlestick did not appear at the end of the uptrend, it showed that the bulls were lacking momentum to push the price higher. Usually, when a trend loses momentum, it later reverses to the opposite direction. This is exactly what is happening now: the pair is under bearish pressure and is already trading under the Tenkan line of the Ichimoku indicator. If the downward trend continues, the next targets will become the Kijun line at 0.9602, and the level of 0.9587 will serve as a strong support. If the price breaks through this mark, the pair will head to the psychologically important level of 0.9500.
In the current situation, a bullish scenario is very unlikely. The uptrend is only possible if the price breaks through the key level of 0.9800. There, however, we can see a number of moving averages (50 MA, 200 EMA and 89 EMA) which can stop the pair from passing the 0.9800 mark.
Daily time frame
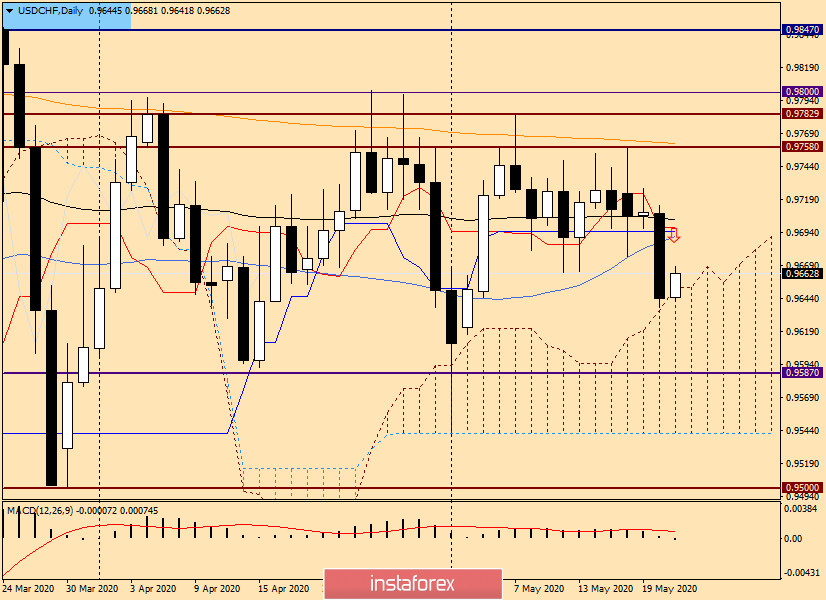
According to the daily chart, the pair eased notably during yesterday's trade. The upper boundary of the Ishimoku cloud served as the level of support. Today, the pair is facing an upward correction after yesterday's decline.
It is worth noting that during yesterday's session the pair passed below the Tenkan line, 50 MA, 89 EMA, and Kijun line which can now serve as a strong level of resistance. If the USD/ CHF pair pulls back to the area of 0.9690-0.9705, we should consider placing short positions. Otherwise, for those trading on the breakout levels, I can recommend placing sell positions on the breakthrough of the support level at 0.9587. Another option is to open short deals after its actual breakout, on a pullback to this mark, or rather, to the area of 0.9585-0.9600.
However, we usually consider the level of support when planning long deals. In case any bullish candlestick patterns appear near the mark of 0.9587 on the daily or minor time frames, you can try opening long positions on the pair. Then it is better to set small targets with 30-40 pips.
H4
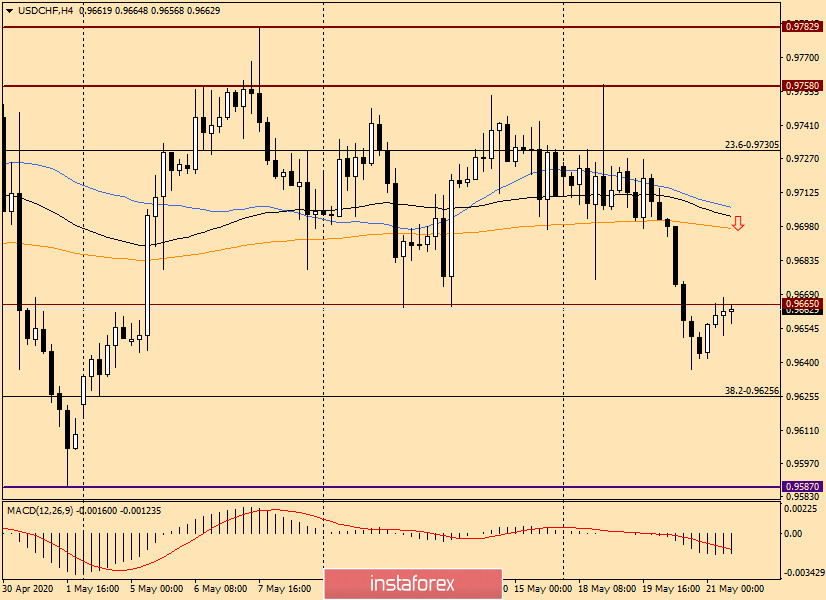
After edging down below the current moving averages, the price broke through the support level of 0.9665. By the end of this review, the pair has pulled back to this level. Here I would like to emphasize that placing short positions may not be a good idea. On the one hand, you can try to sell aggressively from the current price which is near the level of 0.9665. At the same time, a deeper correctional pullback is possible to the area of 0.9696-0.9706 of the moving averages. From there, you can plan opening short positions on this currency pair.
To get more certainty before opening longs deals, you should look for some confirmation signals such as the bearish candlestick patterns that will appear in the indicated price range of 0.9696-0.9706 or below 0.9665.
So far, I don't see any clear signals for placing buy positions. However, the market is very unpredictable today amid the situation with the COVID-19 crisis. Stay safe and trade cautiously!
InstaForex analytical reviews will make you fully aware of market trends! Being an InstaForex client, you are provided with a large number of free services for efficient trading.


