 Maradok
Kereskedési feltételek
Products
Eszkozok


The pair traded upward on Wednesday and tested the level of 1.3161 (blue dotted line). Today the price may roll back downward, but much will depend on the news that comes out at 08:30 and 11:30 UTC for the pound, and at 12:30 UT for the dollar.
Trend analysis (Fig. 1).
The market may roll back down from the level of 1.3117 (closing of yesterday's daily candle) with the target of 1.3034 - a 14.6% pullback level (red dotted line). In case of breaking through this level, the downward trend may continue with the next target of 1.2953 - a 23.6% pullback level (red dotted line).
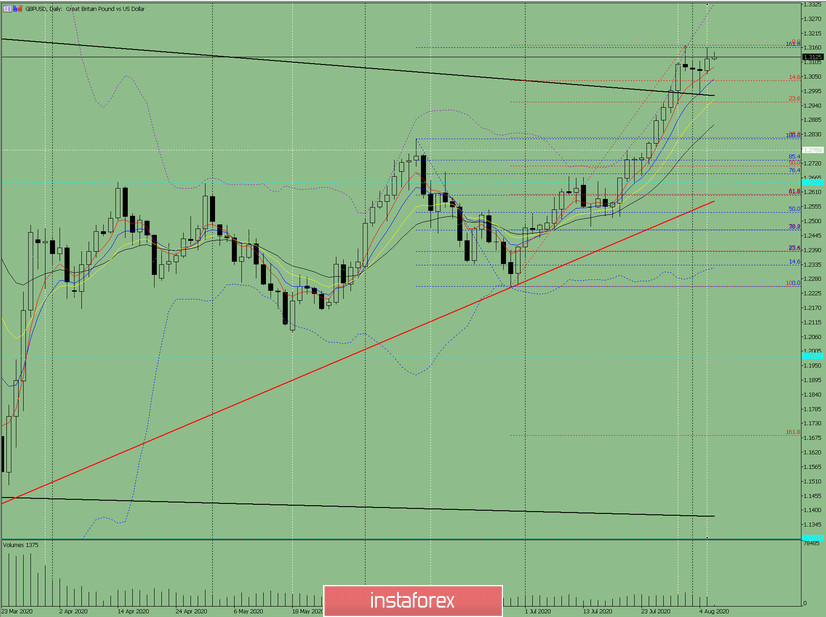
Fig. 1 (daily chart).
Comprehensive analysis:
- Indicator analysis - down;
- Fibonacci levels - down;
- Volumes - down;
- Candlestick analysis - down;
- Trend analysis - down;
- Bollinger lines - down;
- Weekly chart - up.
General conclusion:
Today the price may roll back down with the target of 1.3034 - a 14.6% pullback level (red dashed line). In case of breaking through this level, the downward trend may continue with the next target of 1.2953 - a 23.6% pullback level (red dotted line).
Another possible scenario is after reaching the price level of 1.3161 (blue dotted line) the upward trend may continue with the next target of 1.3287 located at the upper border of the Bollinger line indicator (purple dashed line).
InstaForex analytical reviews will make you fully aware of market trends! Being an InstaForex client, you are provided with a large number of free services for efficient trading.

