 Maradok
Kereskedési feltételek
Products
Eszkozok


The pair moved sideways on Thursday due to the news. At the beginning of the day, the price almost tested the historical resistance level of 1.1912 (blue dotted line), but the news lowered the price by 140 points. The day ended with the resumption of the upward movement. Today the market may continue to move up. No news is expected on the economic calendar.
Trend analysis (Fig. 1).
The market may move upward from the level of 1.1824 (closing of yesterday's daily candle) with the target at the upper fractal 1.1967 (red dotted line). From here, the upward movement may continue with the next target at 1.2102 - a 76.4% pullback level (blue dotted line).
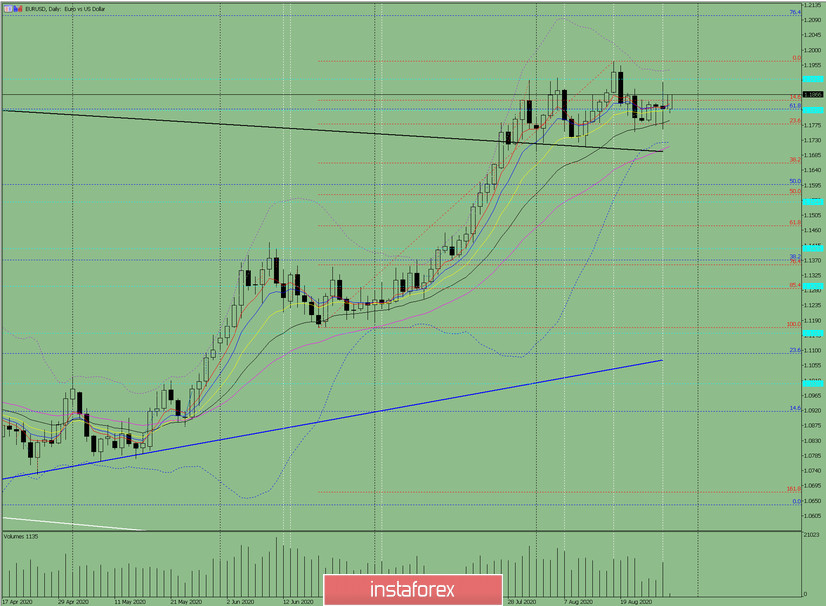
Figure: 1 (daily chart).
Comprehensive analysis:
- Indicator analysis - up;
- Fibonacci levels - up;
- Volumes - up;
- Candlestick analysis - down;
- Trend analysis - down;
- Bollinger lines - up;
- Weekly chart - up.
General conclusion:
Today, the price may move upwards with the target at the upper fractal 1.1967 (red dotted line). From here, the upward trend may continue with the next target at 1.2102 - a 76.4% pullback level (blue dotted line).
Another possible scenario is an upward movement to the historical resistance level of 1.1912 (blue dotted line). In case of testing this level, the price may begin to move down to the lower fractal 1.1803. If this level is broken, the downward movement may continue with the next target at 1.1779 - a 23.6% pullback level (red dashed line).
InstaForex analytical reviews will make you fully aware of market trends! Being an InstaForex client, you are provided with a large number of free services for efficient trading.

