 Maradok
Kereskedési feltételek
Products
Eszkozok


The pair traded upward on Tuesday almost testing the historical resistance level of 1.1912 (blue dotted line) and then went down, making a black daily candlestick. Today, the price may continue to move upward. As per the economic calendar, dollar news is expected at 12:30, 14:30, 18:00, and 18:30 UTC.
Trend analysis (Fig. 1).
The market may continue to move upward from the level of 1.1849 (closing of yesterday's daily candlestick) with the initial target at the historical resistance level of 1.1912 (blue dotted line). If this line is tested, the upward trend may continue with the next target at the upper fractal 1.2012 (red dotted line).
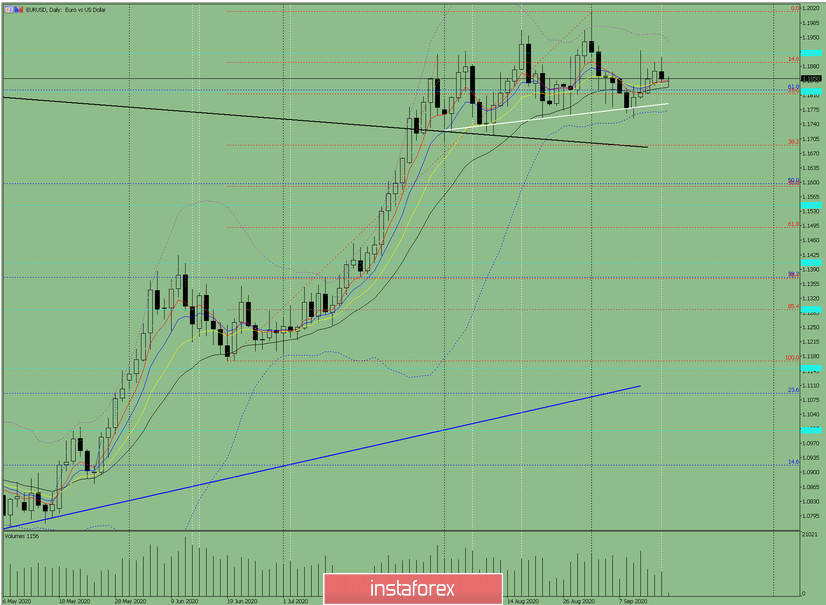
Figure: 1 (daily chart).
Comprehensive analysis:
- Indicator analysis - up;
- Fibonacci levels - up;
- Volumes - up;
- Candlestick analysis - up;
- Trend analysis - up;
- Bollinger lines - up;
- Weekly chart - up.
General conclusion:
Today, the price may continue to move upward with the target at the historical resistance level of 1.1912 (blue dotted line). In case of testing this line, the upward trend may continue with the next target at the upper fractal 1.2012 (red dotted line).
Another possible scenario is upon reaching the historical resistance level of 1.1912 (blue dotted line), the price may begin to move down to the level of 1.1813 - a 38.2% pullback (red dotted line).
InstaForex analytical reviews will make you fully aware of market trends! Being an InstaForex client, you are provided with a large number of free services for efficient trading.


