 Maradok
Kereskedési feltételek
Products
Eszkozok


Trend analysis.
From the level of 1.2917 (closing of the September monthly candlestick), it is likely that the price will increase in October, with the first goal at 1.3077 - a pullback level of 50.0% (blue dotted line). In case of testing this level, it can continue to work further upwards to next upper goal located at 1.3429 - the resistance line (black thick line).
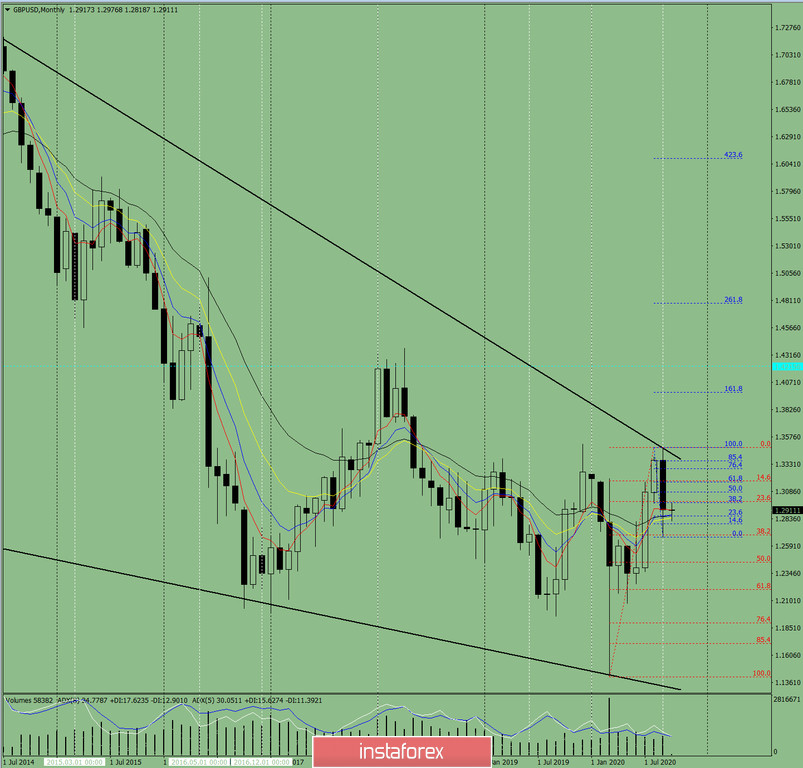
Figure: 1 (monthly chart).
Indicator analysis:
- indicator analysis - up;
- Fibonacci levels - up;
- volumes - up;
- candlestick analysis - down;
- trend analysis - down;
- Bollinger lines - up;
An upward movement can be concluded from the comprehensive analysis.
The general result of the calculation of the candlestick of the GBP/USD pair on the monthly chart: the price is likely to have an upward trend with the first lower shadow (first week of the month - black) at the monthly white candlestick and with the second upper shadow (last week black).
A likely scenario: from the level of 1.2917 (closing of the September monthly candlestick), a decline is possible with the goal at 1.2674 - a lower fractal (blue dashed line). If this level is tested, the price can move up with the goal at 1.3077 - a pullback level of 50.0% (blue dotted line) From this level, we can further rise to the next upper goal at 1.3429 - the resistance line (black thick line).
An unlikely scenario: from the level of 1.2917 (closing of the July monthly candle), a downward movement with the goal of 1.2674 - a lower fractal (blue dotted line) is unlikely.
InstaForex analytical reviews will make you fully aware of market trends! Being an InstaForex client, you are provided with a large number of free services for efficient trading.

