 Maradok
Kereskedési feltételek
Products
Eszkozok


Trend analysis.
Price is expected to move up this week, rising from the level of 1.3280 (closing of the last weekly candle) towards the level of 1.3381 (blue dotted line). If this happens, the GBP / USD pair will continue climbing up to the target level which is 1.3481 - the upper fractal (weekly candle on August 30).
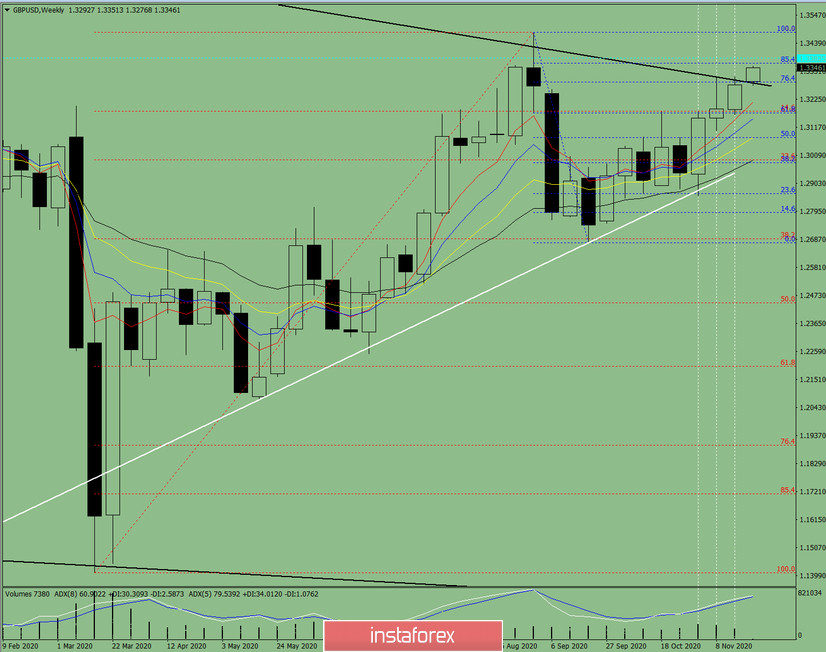
Figure 1 (weekly chart).
Comprehensive analysis:
- indicator analysis - up;
- Fibonacci levels - up;
- volumes - up;
- candlestick analysis - down;
- trend analysis - up;
- Bollinger lines - up;
- monthly chart - up.
Based on comprehensive analysis, the GBP/USD pair will continue its upward movement this week.
The candlestick on the weekly chart also indicates an upward trend for the pair, in which it will have no first lower shadow in the weekly white candlestick (Monday - up) and no second upper shadow (Friday - up).
The first target will be the level of 1.3381 (blue dotted line), which is also the historical resistance level. If this line is reached, the quote will most likely continue moving upwards, towards the target level which is 1.3481 - the upper fractal (blue dotted line).
Another scenario is an upward movement from 1.3280 (closing of the last weekly candle) to 1.3381 (blue dotted line). But in this case, working for a decline towards 1.3177 is possible - 14.6% Fibonacci (red dotted line).
InstaForex analytical reviews will make you fully aware of market trends! Being an InstaForex client, you are provided with a large number of free services for efficient trading.

