 Maradok
Kereskedési feltételek
Products
Eszkozok


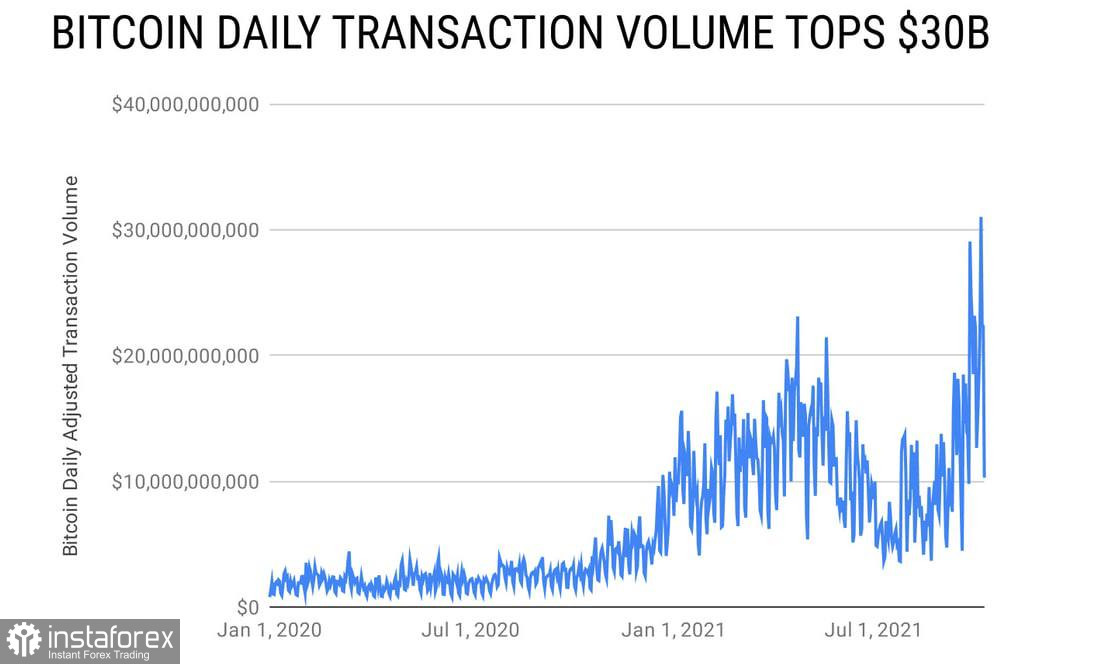
Bitcoin is one step away from reaching a historical high, which is likely to be hit quite soon. Apart from that, the on-chain activity is also high. Besides, bitcoin has won back luster with market participants. A few days ago, a new historical record was set in the BTC network for daily transaction volumes, worth $30 billion. Since the beginning of 2020, this indicator has increased by 40 times, signaling high demand for the digital asset among crypto traders. So, many experts are now sure that the bitcoins' rally will soon start. However, before making bullish calls on the cryptocurrency, it is necessary to conduct technical analysis and make sure that the price continues to move up after hitting a record level.
The Relative Strength Index (RSI) is a technical indicator that helps you determine the strength of a trend (descending or ascending) and warns of possible changes in the price movement. Thanks to this indicator, it is possible to determine at what level the asset gets overbought or oversold. The 60 level indicates bullish momentum. It means that there is a high demand for the coin and the current upward momentum is strong. When crossing this mark, the coin begins to move towards the overbought zone.
Moving average convergence divergence (MACD) is a trend-following momentum indicator that shows the relation between two moving averages of an asset's price. The bullish signal is the intersection of the white line under the red and bearish. Alternatively, when the upper white line crosses the red one, it indicates a downward movement.
Stochastic (stochastic oscillator) indicates the strength of the current prevailing trend. If the indicator is above the 80 mark, then the asset can be considered overbought. If the stochastic is below 20, then the asset is oversold.
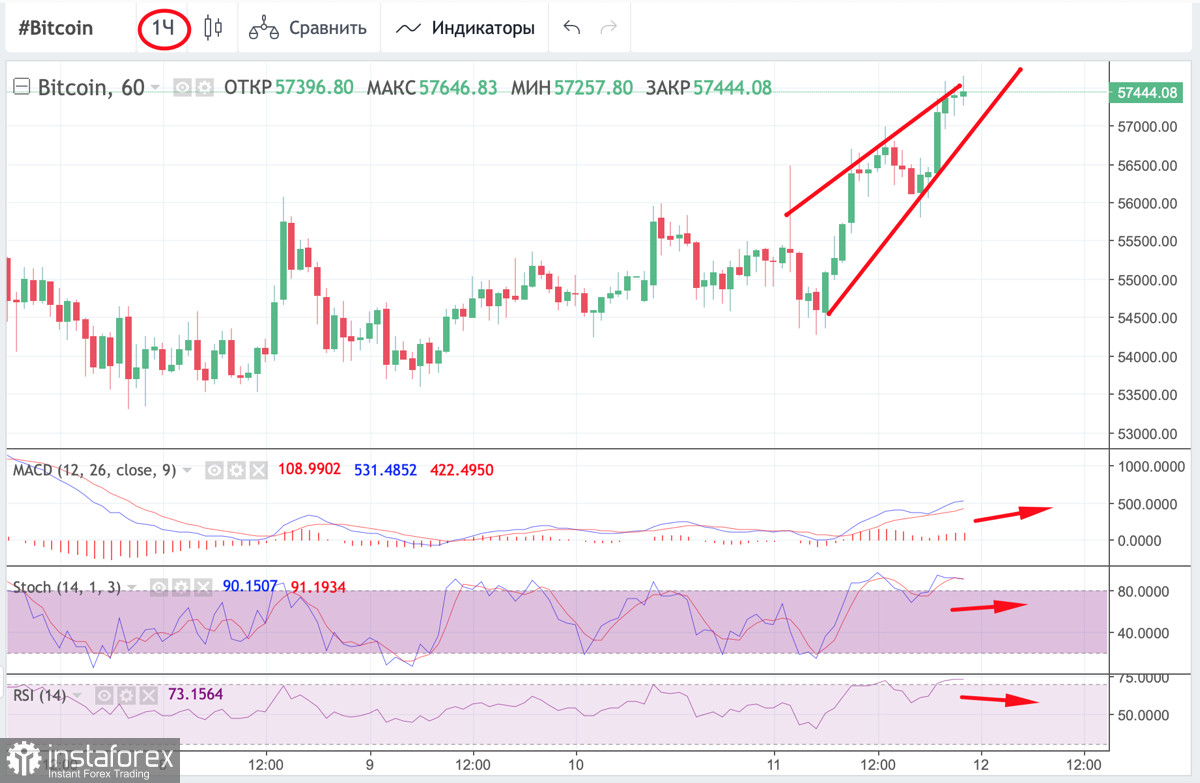
Bitcoin's daily settlement value is directly connected to the growth of the number of unique addresses in the coin network. It may become a catalyst for the further movement of the cryptocurrency in the $58,000-$60,000 resistance area. On the 1H chart, the coin is rising. The main technical indicators are also pointed upwards. The MACD indicator is moving down, but there are signs of a possible sideways movement. The stochastic oscillator managed to form a bullish intersection but failed to push the price above $58,000. The RSI indicator approached 70. However, it is changing a direction and moving sideways. Judging by the 1H chart, the current bullish momentum is losing strength and indicators are beginning to decline.
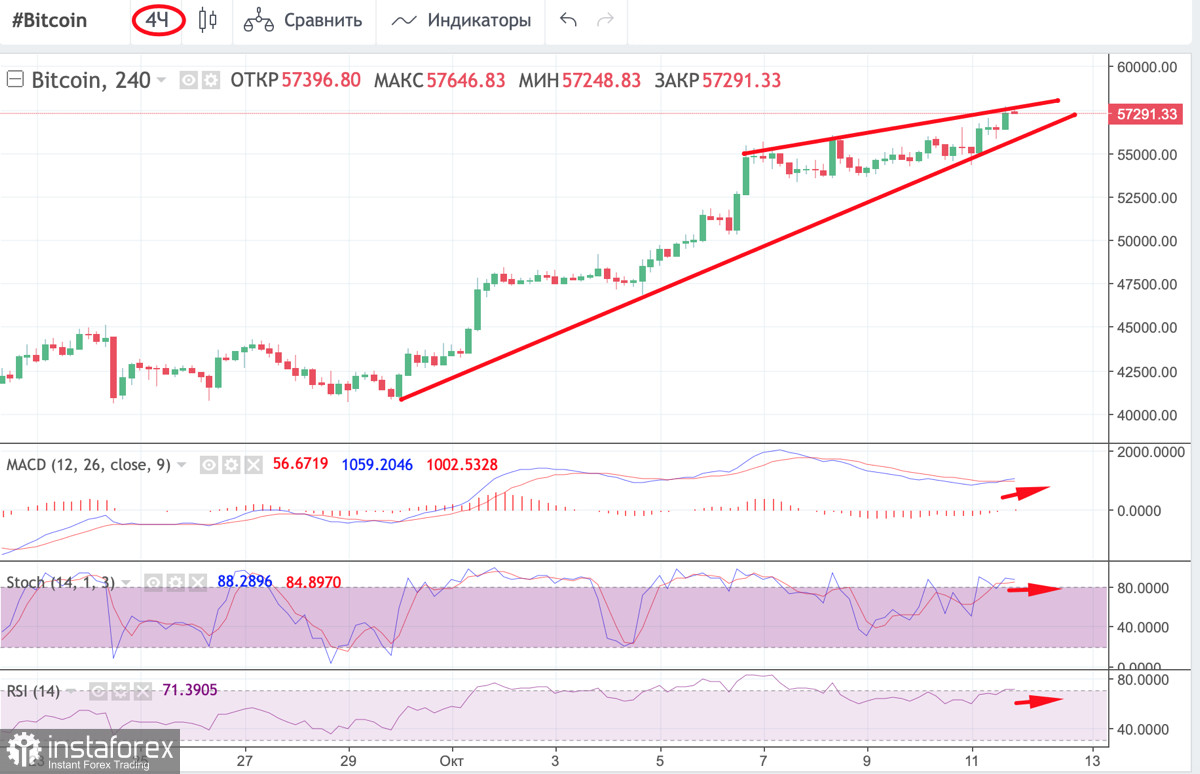
On the 4H chart, bullish momentum seems solid. MACD has formed a bullish intersection and it is moving up. The stochastic and the RSI indicators are moving sideways. It indicates that the bullish momentum is strong and may continue. So, at the end of today, bitcoin is likely to try to break above the $58,000 level. Shortly after, it may decline.
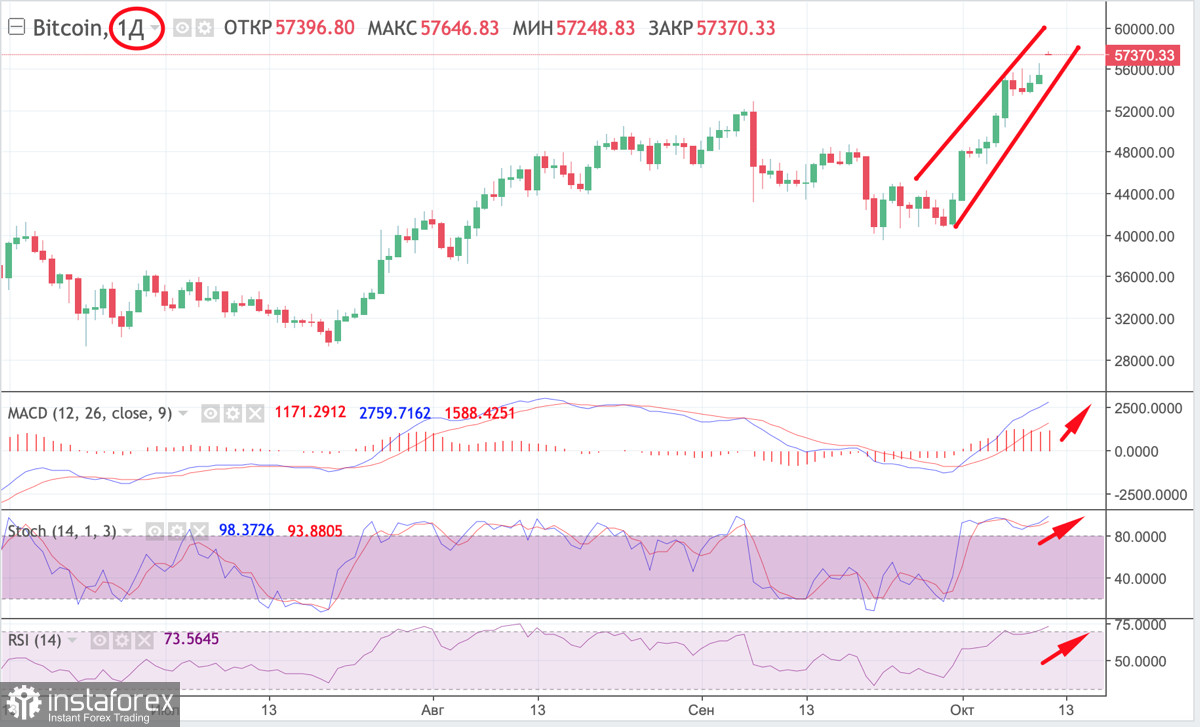
The daily chart shows the continuation of the uptrend. It has entered the range of $58,000-$60,000. The main technical indicators are steadily rising. MACD continues to grow and the stochastic formed a bullish intersection. At the same time, the RSI indicator is moving sideways along the support zone, which indicates that there are no reasons for a correction. On the chart, there is also a bullish flag pattern that may also signal an uptrend. Taking into account the technical analysis, today, BTC may face a strong resistance level, which may turn into a correction. However, the bullish momentum is strong and BTC is likely to consolidate above $58,000-$60,000 in the near future.
InstaForex analytical reviews will make you fully aware of market trends! Being an InstaForex client, you are provided with a large number of free services for efficient trading.

