 Maradok
Kereskedési feltételek
Products
Eszkozok


Trend analysis
This month, the price from the level of 1.3540 (closing of the December monthly candlestick) is expected to rise to the target of 1.3742 – the historical resistance level (blue dotted line). After testing this level, it may continue its growth to the target of 1.3877 – the resistance line (black bold line). Once this line is reached, it may decline to the next lower target of 1.3562 – the pullback level of 23.6% (blue dotted line).
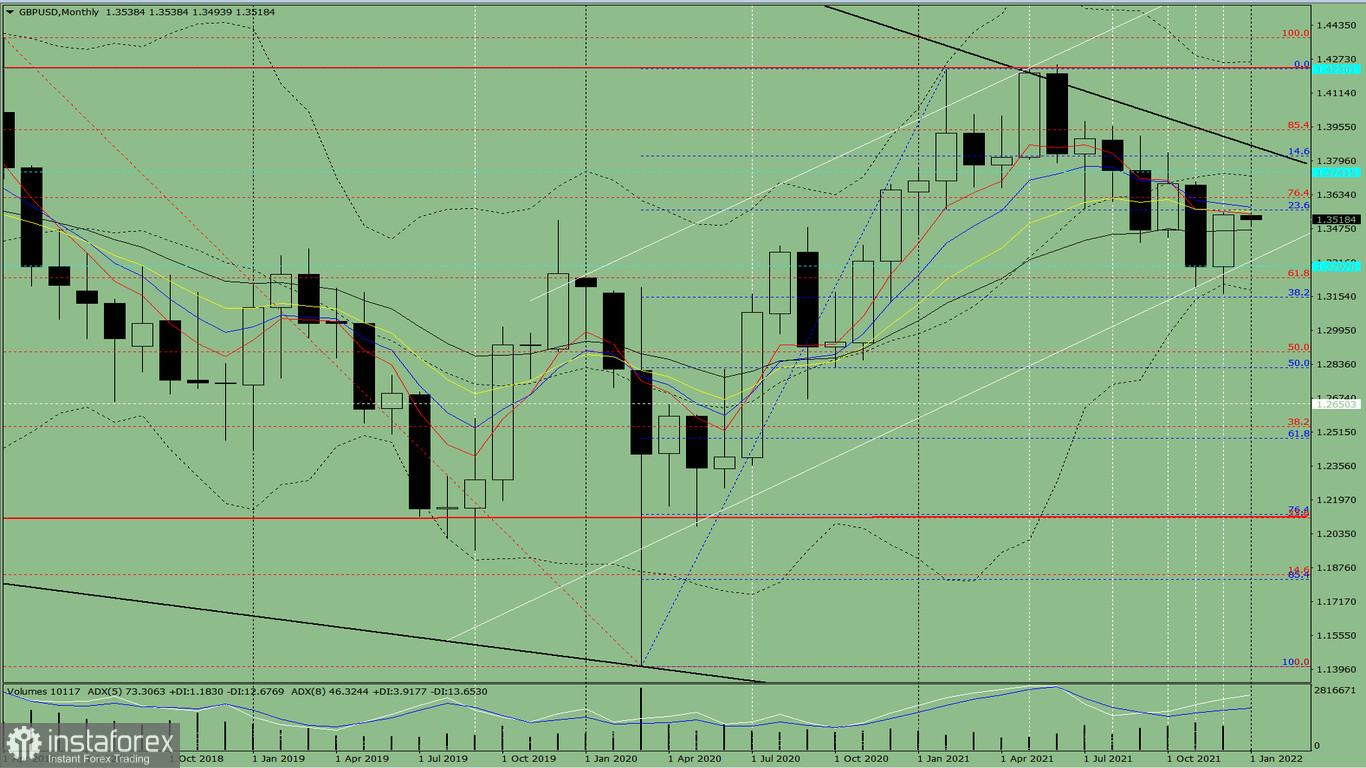
Fig 1 (monthly chart)
Indicator analysis:
An upward movement can be concluded based on a comprehensive analysis.
The overall result of the candlestick calculation based on the monthly chart: the price will most likely move in an upward trend, without the first lower shadow (the first week of the month is white) and with the second upper shadow (the past week is black) in the monthly white candlestick.
General scenario: the price from the level of 1.3540 (closing of the December monthly candlestick) will move up to the target of 1.3742 – the historical resistance level (blue dotted line). After testing this level, it may further grow to the target of 1.3877 – the resistance line (black bold line). If this line is reached, it is likely to fall to the next lower target of 1.3562 – the pullback level of 23.6% (blue dotted line).
As an alternative, the price from the level of 1.3540 (closing of the December monthly candlestick) may decline to the target of 1.3331 – support line (white thin line) and then move up after testing it.
InstaForex analytical reviews will make you fully aware of market trends! Being an InstaForex client, you are provided with a large number of free services for efficient trading.


