 Maradok
Kereskedési feltételek
Products
Eszkozok


Trend analysis (Fig. 1).
The euro-dollar pair may move upward from the level of 0.9978 (close of yesterday's daily candle) to 1.0011, the 23.6% retracement level (white dotted line). Upon reaching this level, a continued upward movement is possible with the target of 1.0042, the 21-period EMA (thin black line). When testing this level, the price may move downward to 1.0002, the 13-period EMA (thin yellow line). From this level, the price may move up.
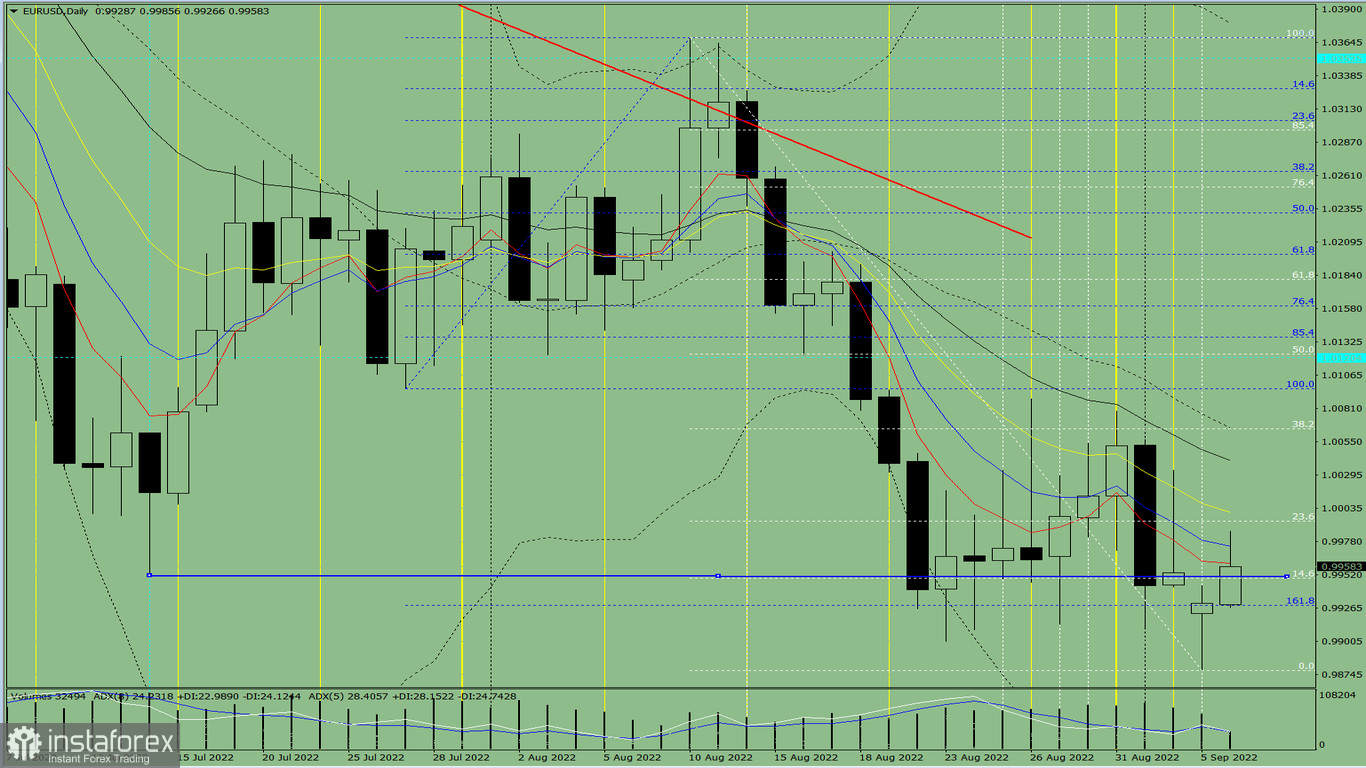
Fig. 1 (daily chart).
Comprehensive analysis:
General conclusion:
Today the price may move upward from the level of 0.9978 (close of yesterday's daily candle) to 1.0011, the 23.6% retracement level (white dotted line). Upon reaching this level, a continued upward movement is possible with the target of 1.0042, the 21-period EMA (thin black line). When testing this level, the price may move downward to 1.0002, the 13-period EMA (thin yellow line). From this level, the price may move up.
Alternative scenario: from the level of 0.9978 (close of yesterday's daily candle), the price may move upward to 1.0011, the 23.6% retracement level (white dotted line). When testing this level, a downward movement is possible towards the support level 0.9951 (thick blue line). When testing this level, the price may move up.
InstaForex analytical reviews will make you fully aware of market trends! Being an InstaForex client, you are provided with a large number of free services for efficient trading.

