 Maradok
Kereskedési feltételek
Products
Eszkozok


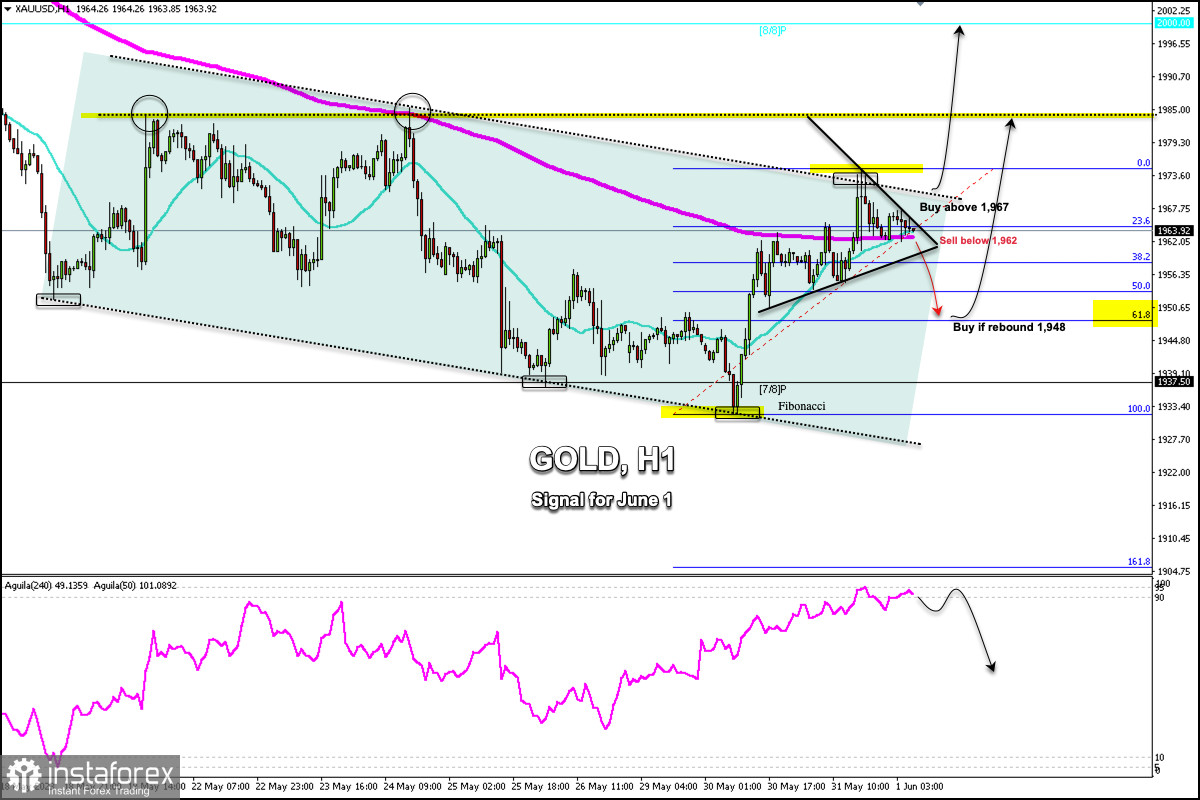
Early in the European session, Gold (XAU/USD) is trading around 1,963.92 above the 21 SMA and 200 EMA. On the 1-hour chart, we can see that gold is trading within a downtrend channel formed since May 18.
Some technical correction is expected to occur in the next few hours because yesterday in the American session, it reached the top of the downtrend channel around 1,974.78.
On the other hand, in case gold falls below the 200 EMA and consolidates below 1,962 in the next few hours, we could expect it to reach the 61.8% Fibonacci around 1,948.
We can also see the formation of a symmetrical triangle. In case gold breaks and consolidates above the downtrend channel around 1,967, we could expect it to reach the 1,984 resistance. This level was tested on May 18 and 23, exerting bearish pressure on gold. If XAU/USD faces this zone in the next few hours and if it breaks it, we could expect the price to reach 8/8 Murray around the psychological level of $2,000.
In the event that gold breaks the symmetrical triangle below, the price could go through a technical correction towards the daily support zone around 1,948. This level coincides with the 61.8% Fibonacci which could offer a strong technical bounce and would be seen as an opportunity to buy with targets at 1,963 and 1,985.
On the 1-hour chart, the eagle indicator reached the extremely overbought zone. If the uptrend continues, a technical correction is expected to occur in the next few days around 1,973 or 1,985. This could be seen as a signal to sell.
Our trading plan for the next few hours is to sell gold below 1,962 with targets at about 1,948. In case the scenario changes and XAU/USD trades above 1,967, it will be seen as a signal to buy with targets at 1,985 and $2,000.
InstaForex analytical reviews will make you fully aware of market trends! Being an InstaForex client, you are provided with a large number of free services for efficient trading.


