 Maradok
Kereskedési feltételek
Products
Eszkozok


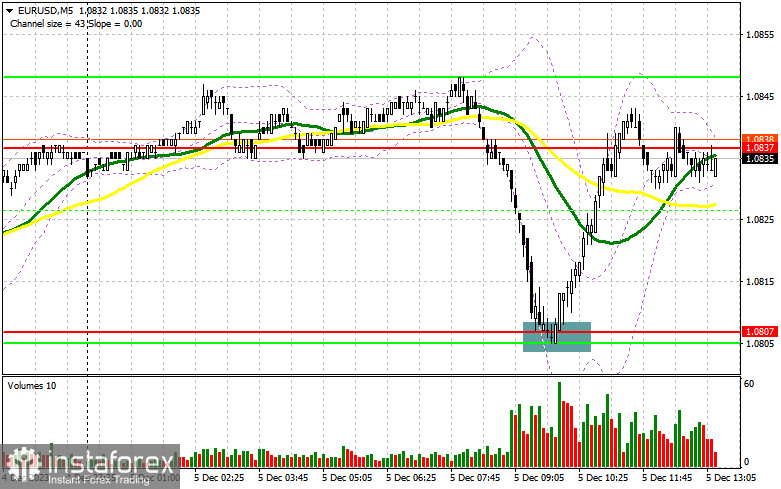
In my morning forecast, I drew attention to the level of 1.0807 and recommended making decisions based on it when entering the market. Let's look at the 5-minute chart and analyze what happened there. The decline and the formation of a false breakout around 1.0807 led to a good buying signal, resulting in the pair rising by more than 30 points. Considering that the level of 1.0837 doesn't represent anything significant, the technical picture was partially revised for the second half of the day.
To open long positions on EUR/USD, the following is required:
Data on activity in the Eurozone for November were revised for the better, limiting pressure on the pair in the first half of the day and allowing buyers to show themselves around the local minimum. During the American session, we await data on the ISM's business activity index in the US services sector. A weak report is another reason for the euro to rise, while strong figures will pressure the pair, leading to another decline of around 1.0807. The formation of a false breakout there, similar to what I analyzed earlier, will provide an entry point for long positions, counting on another rise in EUR/USD and testing the new resistance at 1.0845, formed by the end of the day. The moving averages, playing on the sellers' side, are also located there. Breaking and updating 1.0845 from top to bottom will depend on US data, providing a buy signal and a chance for the pair to recover to around 1.0869. The ultimate target will be the area of 1.0893, where I will take profits. In the scenario of further decline in EUR/USD and the absence of activity at 1.0807 in the second half of the day (this level has already worked once today), trading will remain within the framework of a new descending channel, creating even more problems for buyers. In this case, I will enter the market only after forming a false breakout around 1.0774 – a new local minimum. I will open long positions immediately on the rebound from 1.0749, with the target of an ascending correction by 30-35 points within the day.
To open short positions on EUR/USD, the following is required:
Sellers are still in the market, and plenty of fundamental reasons exist to increase short positions. However, the price needs to be below 1.0845 to seize the initiative. It is best to wait for data on US PMI indices, and in case of growth, only the formation of a false breakout at 1.0845 will provide an excellent sell signal, counting on further building a bearish market. The target will be support at 1.0807, which worked once today. Only after breaking and consolidating below this range and a reverse test from bottom to top do I expect to get another sell signal with an exit to 1.0774. The ultimate target will be a minimum of 1.0749, where I will take profits. In the event of an upward movement in EUR/USD during the American session and the absence of bears at 1.0845, where the moving averages are located, buyers will try to return to the market. This will open the way to 1.0869. Selling there is possible, but only after an unsuccessful consolidation. I will open short positions immediately on the rebound from 1.0893 with the goal of a descending correction by 30-35 points.

Indicator signals:
Moving averages
Trading is carried out below the 30 and 50-day moving averages, indicating the advantage of sellers.
Note: The author sets the period and prices of the moving averages on the H1 chart and differs from the general definition of classical daily moving averages on the D1 chart.
Bollinger Bands
In case of a decline, the lower boundary of the indicator, around 1.0807, will act as support.
Description of indicators:
Moving average (determines the current trend by smoothing volatility and noise). Period 50. Marked on the chart in yellow.
Moving average (determines the current trend by smoothing volatility and noise). Period 30. Marked on the chart in green.
MACD indicator (Moving Average Convergence/Divergence — convergence/divergence of moving averages). Fast EMA period 12. Slow EMA period 26. SMA period 9.
Bollinger Bands (Bollinger Bands). Period 20.
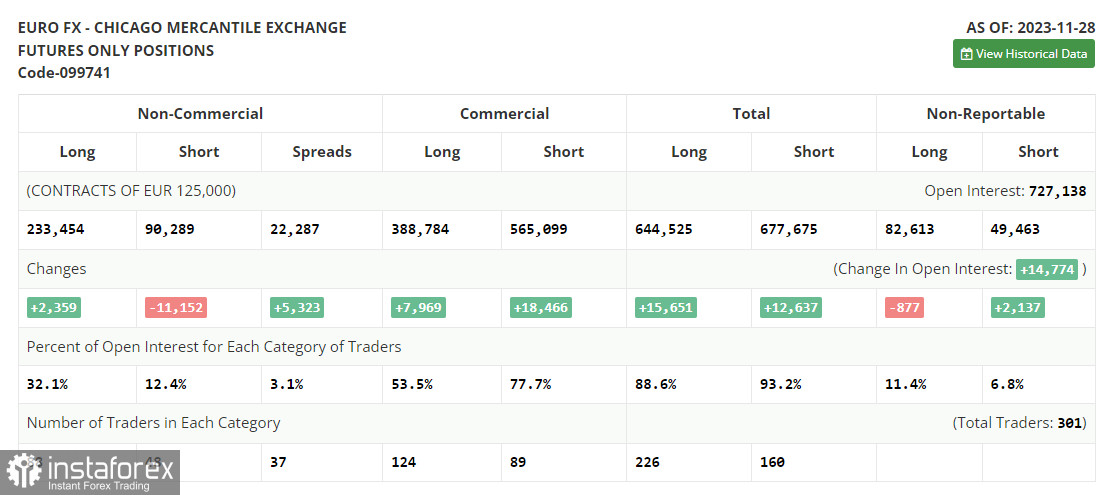
Non-commercial traders - speculators, such as individual traders, hedge funds, and large institutions, use the futures market for speculative purposes and meet certain requirements.
Long non-commercial positions represent the total long open position of non-commercial traders.
Short non-commercial positions represent the total short open positions of non-commercial traders.
The total non-commercial net position is the difference between non-commercial traders' short and long positions.
InstaForex analytical reviews will make you fully aware of market trends! Being an InstaForex client, you are provided with a large number of free services for efficient trading.

