 Maradok
Kereskedési feltételek
Products
Eszkozok


No significant movements from the EUR/USD pair on Monday, which was quite expected. The only notable event for the day was the inflation report from Germany. However, Germany is just one country out of 27 in the European Union, so obviously, the overall European inflation data, which will be published today, is more important for the market and the euro.
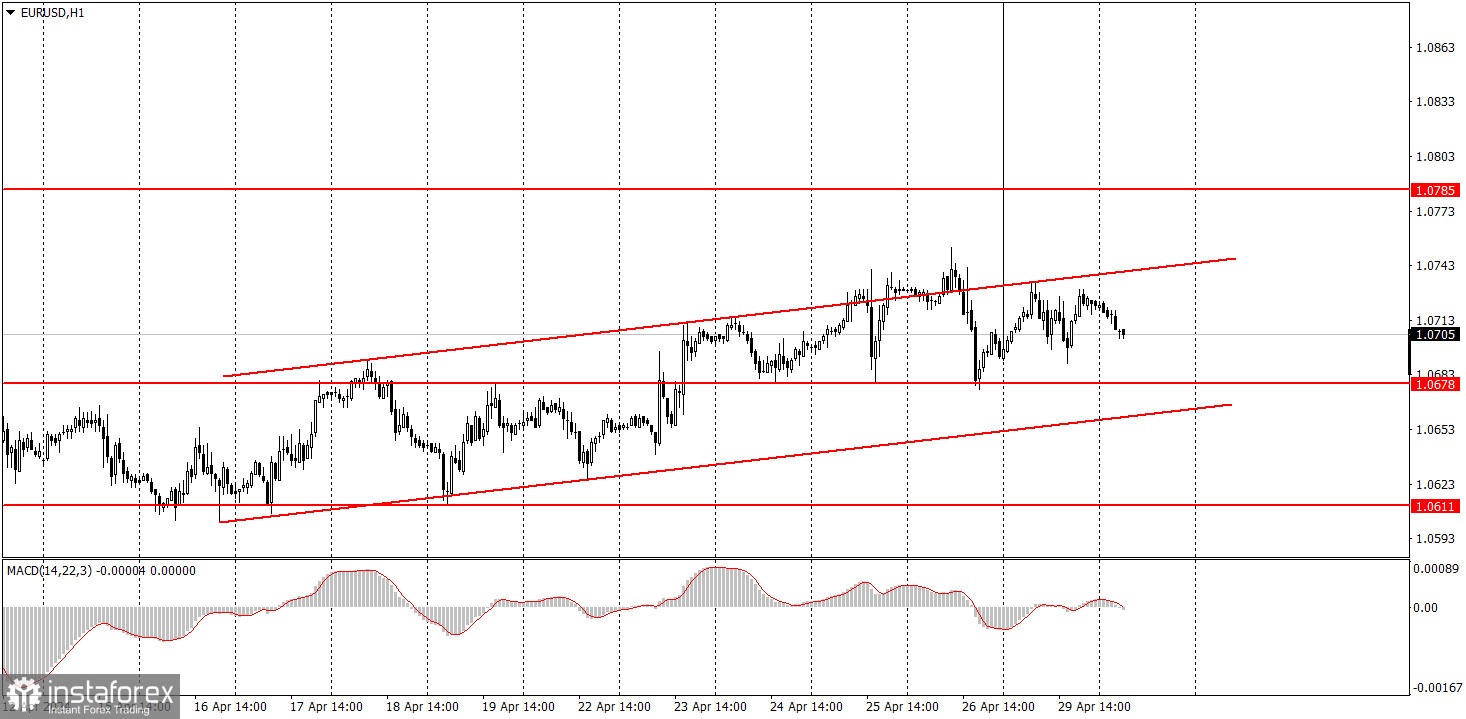
Furthermore, the inflation figures for Germany were hardly groundbreaking. The market expected consumer prices to rise 2.3%, but the actual figure came in at 2.2%, and it was the same rate as in March. Therefore, there was nothing for traders to react to. The price remains within an ascending channel, which clearly appears to be corrective. We don't expect the euro to decline until the price consolidates below this channel. However, as before, we anticipate downward movement in the medium term.
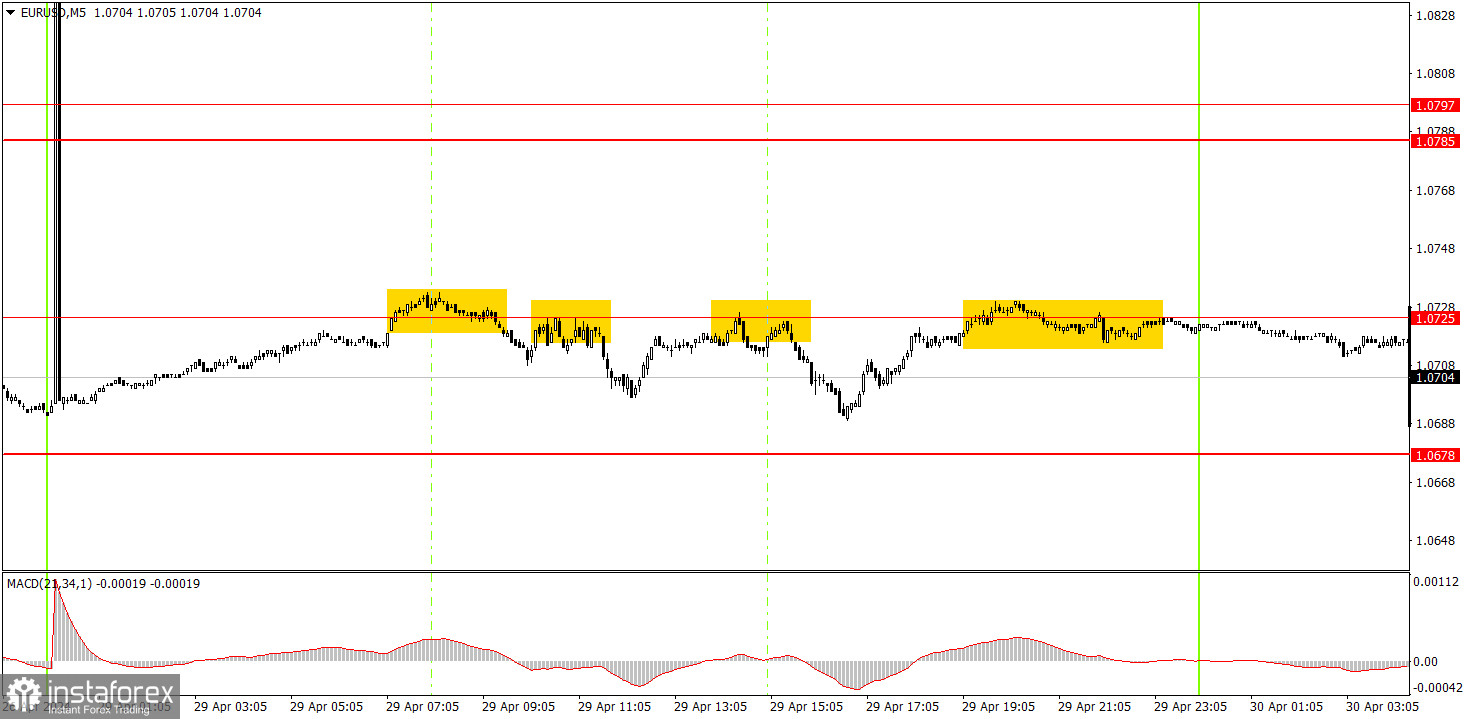
Four sell signals were formed around the level of 1.0725 on the 5-minute timeframe. The pair bounced off this level four times. In the most favorable scenario, it fell by 20 pips. There were no buy signals, so there couldn't have been any loss on the short positions. The price never managed to reach the nearest target level, so it was very difficult to make profit from the trades.
On the hourly chart, the downtrend persists, but the EUR/USD pair is currently correcting higher. We believe that the euro should continue to fall in the medium term, as it is still too high, and in general, the trend is headed downwards. However, at the moment, the market is likely gathering strength before it starts a new downward movement.
Today, the pair may continue its downward movement as it bounced off the upper boundary of the channel. If the price consolidates below the ascending channel, it would signal the start of a new leg in the downward trend. In this case, we should expect a significant decline in the euro.
The key levels on the 5M chart are 1.0483, 1.0526, 1.0568, 1.0611, 1.0678, 1.0725, 1.0785-1.0797, 1.0838-1.0856, 1.0888-1.0896, 1.0940, 1.0971-1.0981. Market participants now look to the release of the inflation and GDP reports in the European Union. Germany will also release reports on retail sales, the unemployment rate, and GDP for the first quarter. As a result, we may see significant movements in the morning, which could continue into the US session.
1) Signal strength is determined by the time taken for its formation (either a bounce or level breach). A shorter formation time indicates a stronger signal.
2) If two or more trades around a certain level are initiated based on false signals, subsequent signals from that level should be disregarded.
3) In a flat market, any currency pair can produce multiple false signals or none at all. In any case, the flat trend is not the best condition for trading.
4) Trading activities are confined between the onset of the European session and mid-way through the U.S. session, after which all open trades should be manually closed.
5) On the 30-minute timeframe, trades based on MACD signals are only advisable amidst substantial volatility and an established trend, confirmed either by a trendline or trend channel.
6) If two levels lie closely together (ranging from 5 to 15 pips apart), they should be considered as a support or resistance zone.
Support and Resistance price levels can serve as targets when buying or selling. You can place Take Profit levels near them.
Red lines represent channels or trend lines, depicting the current market trend and indicating the preferable trading direction.
The MACD(14,22,3) indicator, encompassing both the histogram and signal line, acts as an auxiliary tool and can also be used as a signal source.
Significant speeches and reports (always noted in the news calendar) can profoundly influence the price dynamics. Hence, trading during their release calls for heightened caution. It may be reasonable to exit the market to prevent abrupt price reversals against the prevailing trend.
Beginning traders should always remember that not every trade will yield profit. Establishing a clear strategy coupled with sound money management is the cornerstone of sustained trading success.
InstaForex analytical reviews will make you fully aware of market trends! Being an InstaForex client, you are provided with a large number of free services for efficient trading.

