 Maradok
Kereskedési feltételek
Products
Eszkozok


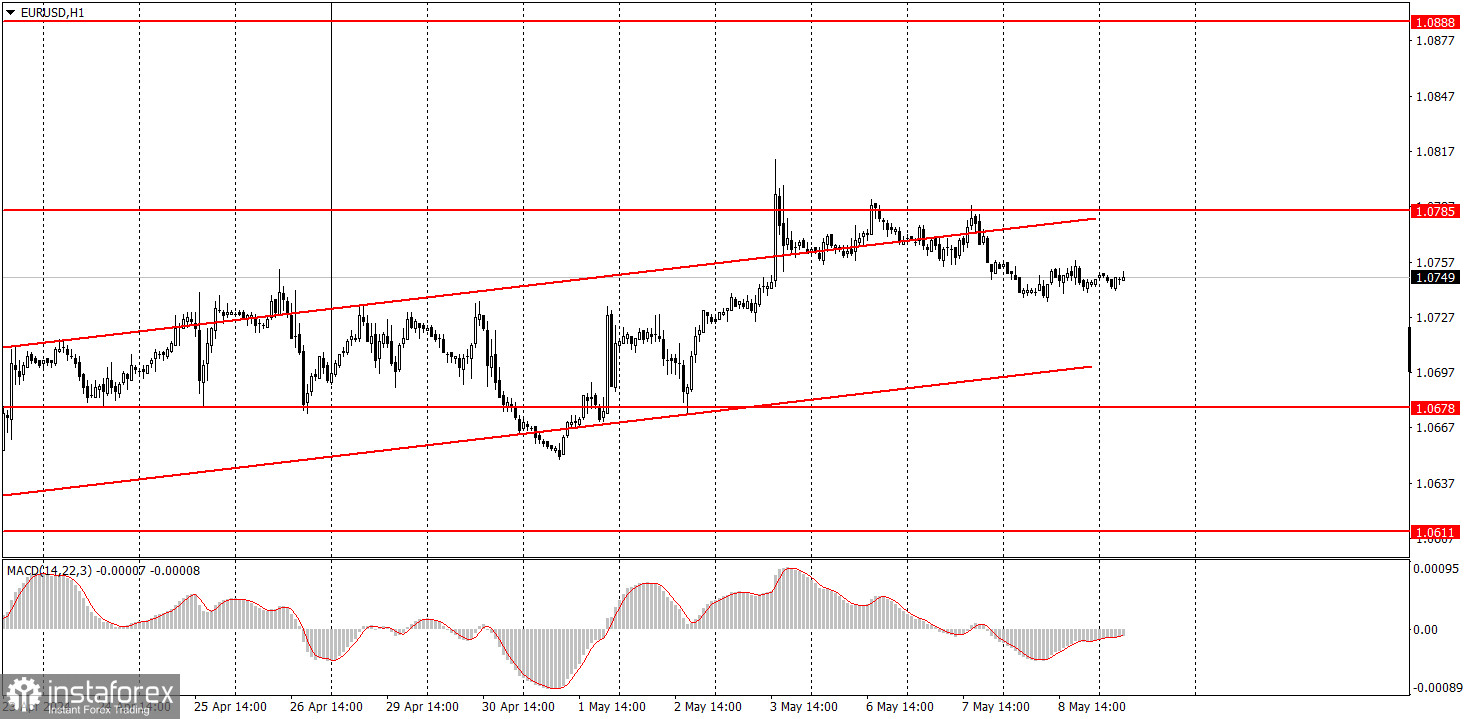
EUR/USD remained stagnant on Wednesday. Volatility for the entire day was only 22 pips. It was obvious that it made no sense for traders to enter the market with such movements. In general, the pair is still within an ascending channel, which means that the pair will continue to go through a correction in the medium term. Take note that all of the pair's upward movement in recent weeks has been part of a correction. However, unless the quotes settle below the channel, novice traders shouldn't expect the euro to start a downward movement. The pair has been basically motionless this week, in the absence of a fundamental or macroeconomic background. Therefore, there are no grounds to expect strong movements.
Ironically, EUR/USD could show notable movement today as the Bank of England is set to announce the results of its meeting. Volatility for the pound may gradually increase, which means that the euro may also show decent movements on Thursday.
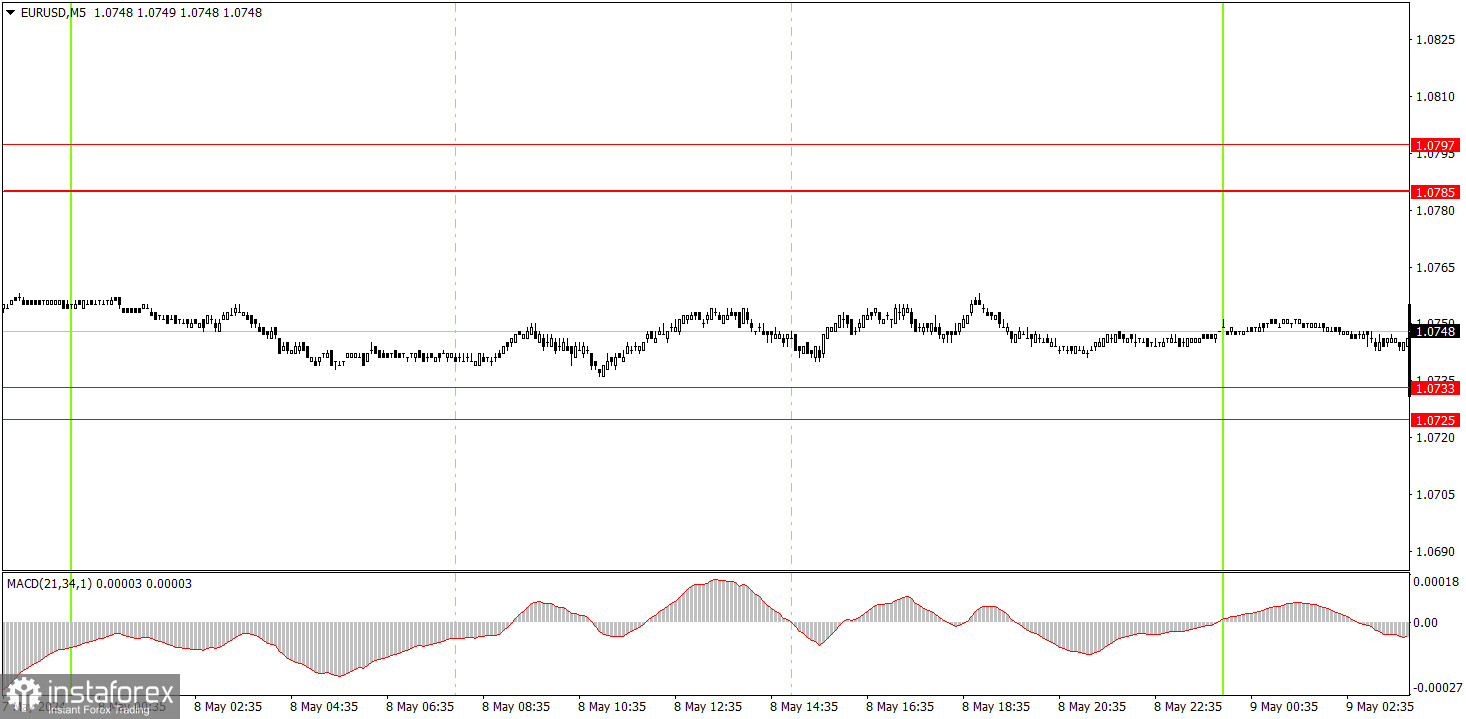
The pair did not generate any entry signals on the 5-minute timeframe. The euro strictly moved along the level of 1.0733 all day and did not even touch this mark. We believe that the absence of trading signals is for the best. One could only expect losses with just 22-pips of volatility.
On the hourly chart, the EUR/USD pair continues to go through a corrective phase. We believe that the decline should resume in the medium term, as the euro remains expensive, and in general, the global trend is pointed downwards. The fundamental background still works in favor of the US dollar, and the latest FOMC meeting proved this - now Federal Reserve Chair Jerome Powell doesn't even know when monetary policy easing will begin.
On Thursday, we advise you to closely monitor the area between 1.0725-1.0733. If the price consolidates below the channel and the area between 1.0725-1.0733, you may consider short positions with targets at 1.0611 and 1.0678. The euro may rise if the price rebounds from the specified area.
The key levels on the 5M chart are 1.0483, 1.0526, 1.0568, 1.0611, 1.0678, 1.0725-1.0733, 1.0785-1.0797, 1.0838-1.0856, 1.0888-1.0896, 1.0940, 1.0971-1.0981. Today, there are no scheduled reports in the European Union, and the US docket will only feature a secondary report on initial jobless claims. However, volatility may still increase due to the British central bank meeting and BoE Governor Andrew Bailey's speech.
1) Signal strength is determined by the time taken for its formation (either a bounce or level breach). A shorter formation time indicates a stronger signal.
2) If two or more trades around a certain level are initiated based on false signals, subsequent signals from that level should be disregarded.
3) In a flat market, any currency pair can produce multiple false signals or none at all. In any case, the flat trend is not the best condition for trading.
4) Trading activities are confined between the onset of the European session and mid-way through the U.S. session, after which all open trades should be manually closed.
5) On the 30-minute timeframe, trades based on MACD signals are only advisable amidst substantial volatility and an established trend, confirmed either by a trendline or trend channel.
6) If two levels lie closely together (ranging from 5 to 15 pips apart), they should be considered as a support or resistance zone.
Support and Resistance price levels can serve as targets when buying or selling. You can place Take Profit levels near them.
Red lines represent channels or trend lines, depicting the current market trend and indicating the preferable trading direction.
The MACD(14,22,3) indicator, encompassing both the histogram and signal line, acts as an auxiliary tool and can also be used as a signal source.
Significant speeches and reports (always noted in the news calendar) can profoundly influence the price dynamics. Hence, trading during their release calls for heightened caution. It may be reasonable to exit the market to prevent abrupt price reversals against the prevailing trend.
Beginning traders should always remember that not every trade will yield profit. Establishing a clear strategy coupled with sound money management is the cornerstone of sustained trading success.
InstaForex analytical reviews will make you fully aware of market trends! Being an InstaForex client, you are provided with a large number of free services for efficient trading.

