 Maradok
Kereskedési feltételek
Products
Eszkozok

GBP/USD is still trading sideways in Tuesday's session and the corrective phase could extend towards the 200 SMA on H1 chart, at which a dynamic support could be found. The resistance zone of 1.3592 continues to be the line in the sand for the pair, as it's struggling to consolidate above it. MACD indicator is trying to turn positive, favoring to the upside.
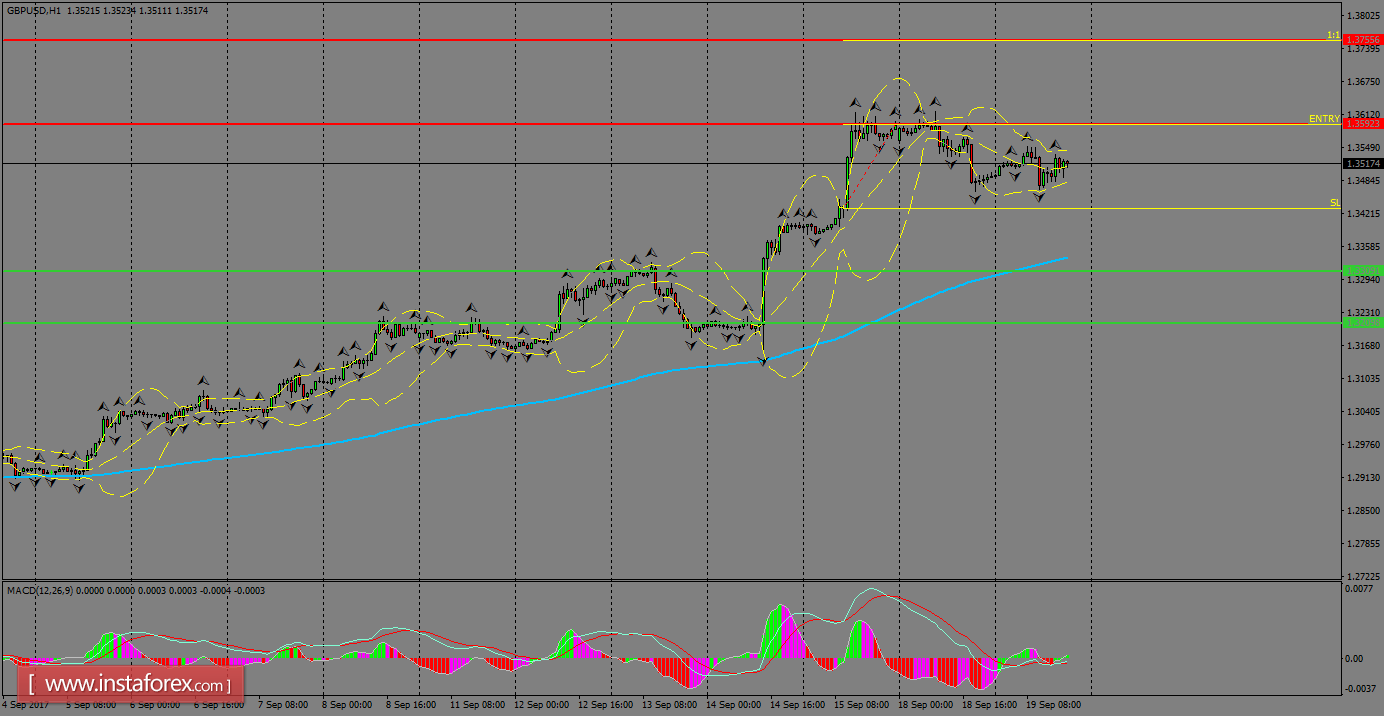
H1 chart's resistance levels: 1.3592 / 1.3755
H1 chart's support levels: 1.3309 / 1.3209
Trading recommendations for today: Based on the H1 chart, buy (long) orders only if the GBP/USD pair breaks a bullish candlestick; the resistance level is at 1.3592, take profit is at 1.3755 and stop loss is at 1.3430.
InstaForex analytical reviews will make you fully aware of market trends! Being an InstaForex client, you are provided with a large number of free services for efficient trading.


