 Permanecer
Condições de Negociações
Ferramentas


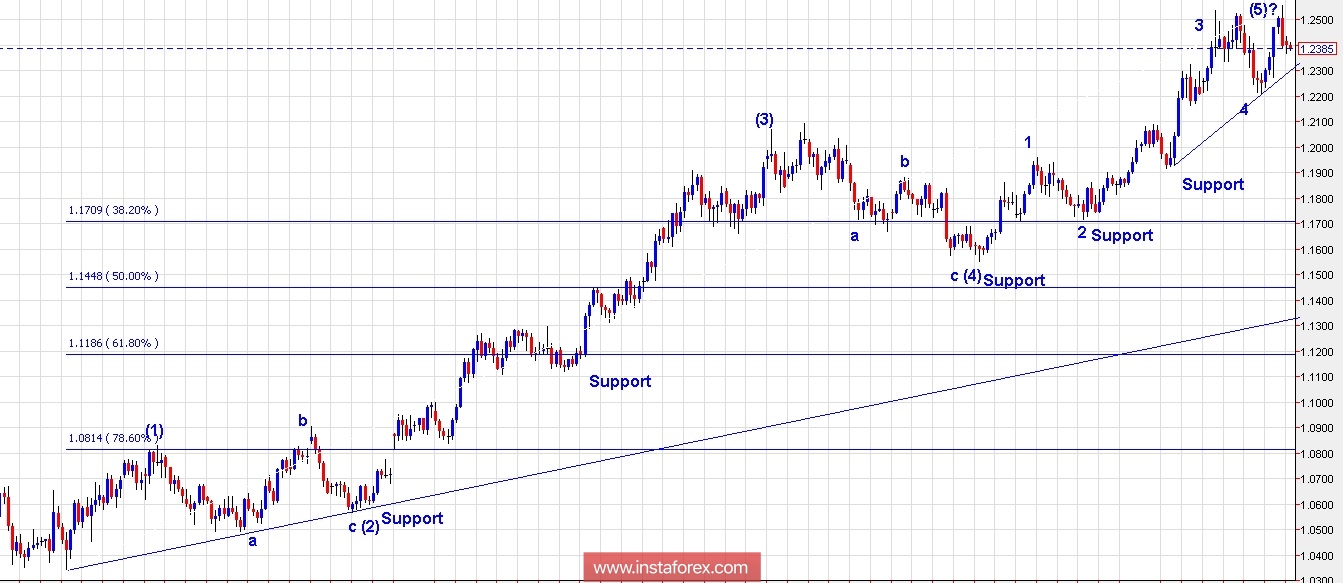
Technical outlook:
The EURUSD daily chart wave counts have been presented here from January 2017 till now. The pair looks to be progressing into its 5th of (5)th wave as labeled here. A drop below 1.2205 would negative the above view and confirm that a meaningful top is in place and that EURUSD would be heading south from there. On the other hand, a bullish turn from around these levels would continue the 5th wave rally and look to terminate around 1.2600/1.2700 levels before turning bearish. Educational wave counts can be viewed on my channel. Please note that the latter scenario is more probable but still holding longs for too many profits is not advisable. In fact, looking to find opportunities to sell rallies would be a safe trading strategy. Immediate support on the daily chart is at 1.2205 levels, while resistance is seen at 1.2650 levels respectively.
Trading plan:
Look to sell on rallies through 1.2600/1.2700 levels.
US Dollar Index chart setups:
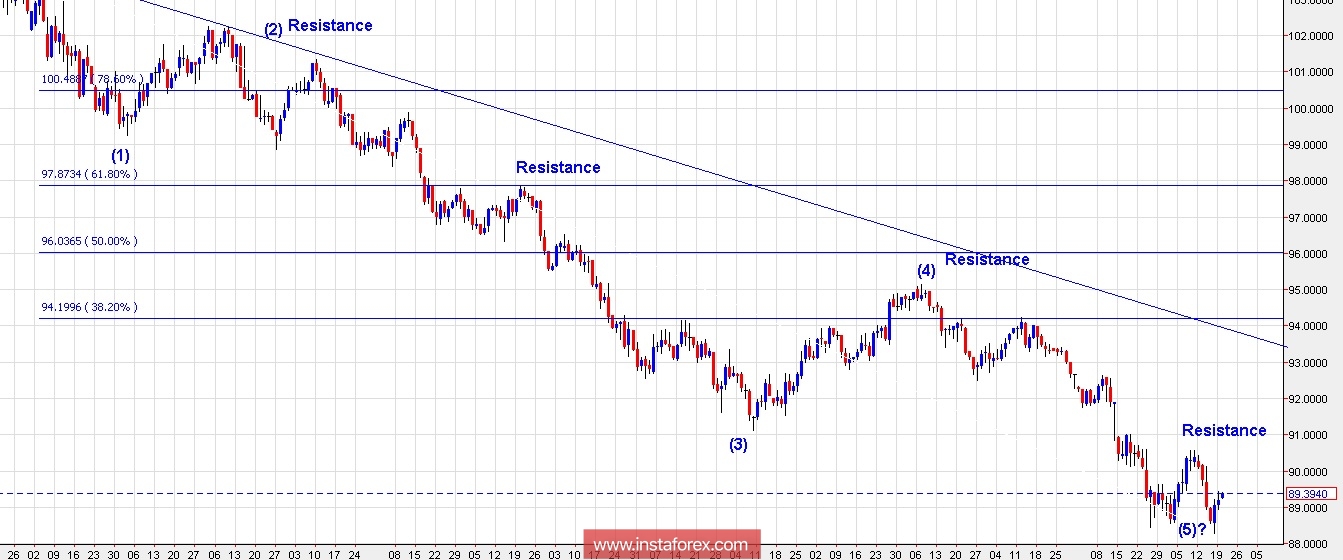
Technical outlook:
The US Dollar Index daily chart wave counts have been presented here since January 2017 levels. It is quite clear that the index is near to completing 5 waves impulse lower from 103.80 levels. The 5th of 5th wave is either under progression or it is terminated giving way to a bullish reversal. To confirm that a meaningful bottom is in place, the US Dollar Index needs to break above 90.50/60 levels from here. Failing to do so would indicate that yet another low is possible before it would turn bullish. Please note that though the latter scenario is highly probable, going aggressively short isn't a great strategy at the moment. Rather look for opportunities and buy lower is a more safe and stable trade plan. Immediate resistance is seen at 90.50/60 levels on the daily chart while support should be strong around 87.80 levels going forward.
Trading plan:
Look for opportunities to buy close to 88.00 levels.
Fundamental outlook:
Watch out for EURO ZONE Economic Sentiment Survey to be out at 0500 AM EST.
Good luck!
InstaForex analytical reviews will make you fully aware of market trends! Being an InstaForex client, you are provided with a large number of free services for efficient trading.


