 Permanecer
Condições de Negociações
Ferramentas


Yesterday's Chart on XAU/USD
After falling down to the 1,693.69 support level, the price has pulled back close to the strong resistance area around 1,725.11. After having touched 1,693.69, the price formed a double bottom on that level which increased support significance.
Strong support formed a bullish Pinbar that pushed the price outside of the downtrend channel on H4 time frame. Moving outside from the downtrend channel, the price has managed to avoid a bears' trap where they could push the price below 1,693.69.
Outlook for XAU/USD
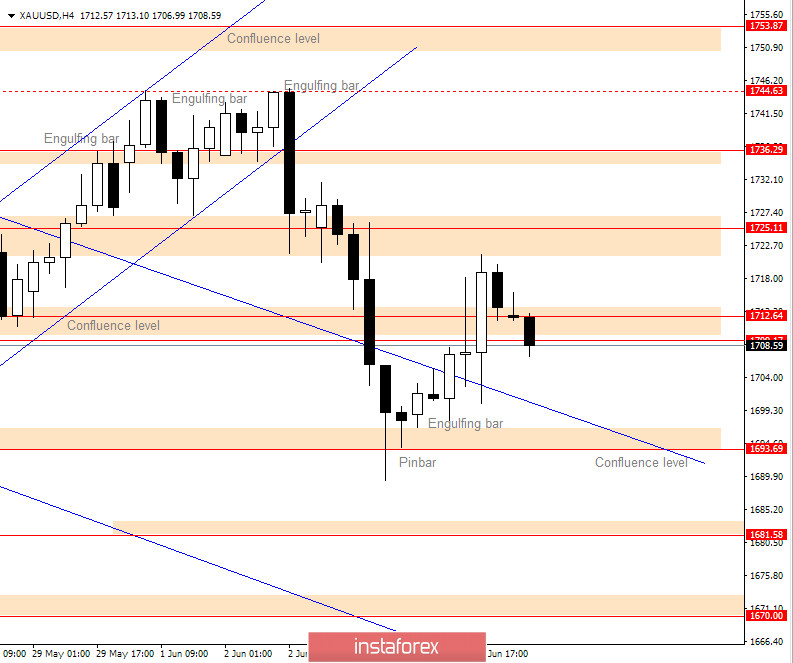
The price has found resistance at 1,712.64, but bulls have managed to bring the price above, close to 1,725.11, the level crucial for bulls if they want to move the price higher.
As the price is currently is a strong bullish area where bears did not formed any candle, that could suggest the price moving down easily.
It seems this area between 1,693.69 and 1,725.11 will be the area where the price will need to find a place for a breakout.
XAU/USD Chart. Bullish Scenario
Bulls need the price above 1,725.11 if they want to move the price higher to 1,753.87. When the breakout above happens, we could wait for a pullback and a bullish signal that will tell us to enter into the market.
XAU/USD Chart. Bearish Scenario
Bears needs the price below 1,693.69 to move down to 1,670.00. Currently, the price could move down to the double bottom level where the downtrend channel line crosses with the support level. That cross area is a confluence level, so that traders can figure out whether the price will break down or it will bounce and move up.
InstaForex analytical reviews will make you fully aware of market trends! Being an InstaForex client, you are provided with a large number of free services for efficient trading.


