 Permanecer
Condições de Negociações
Ferramentas


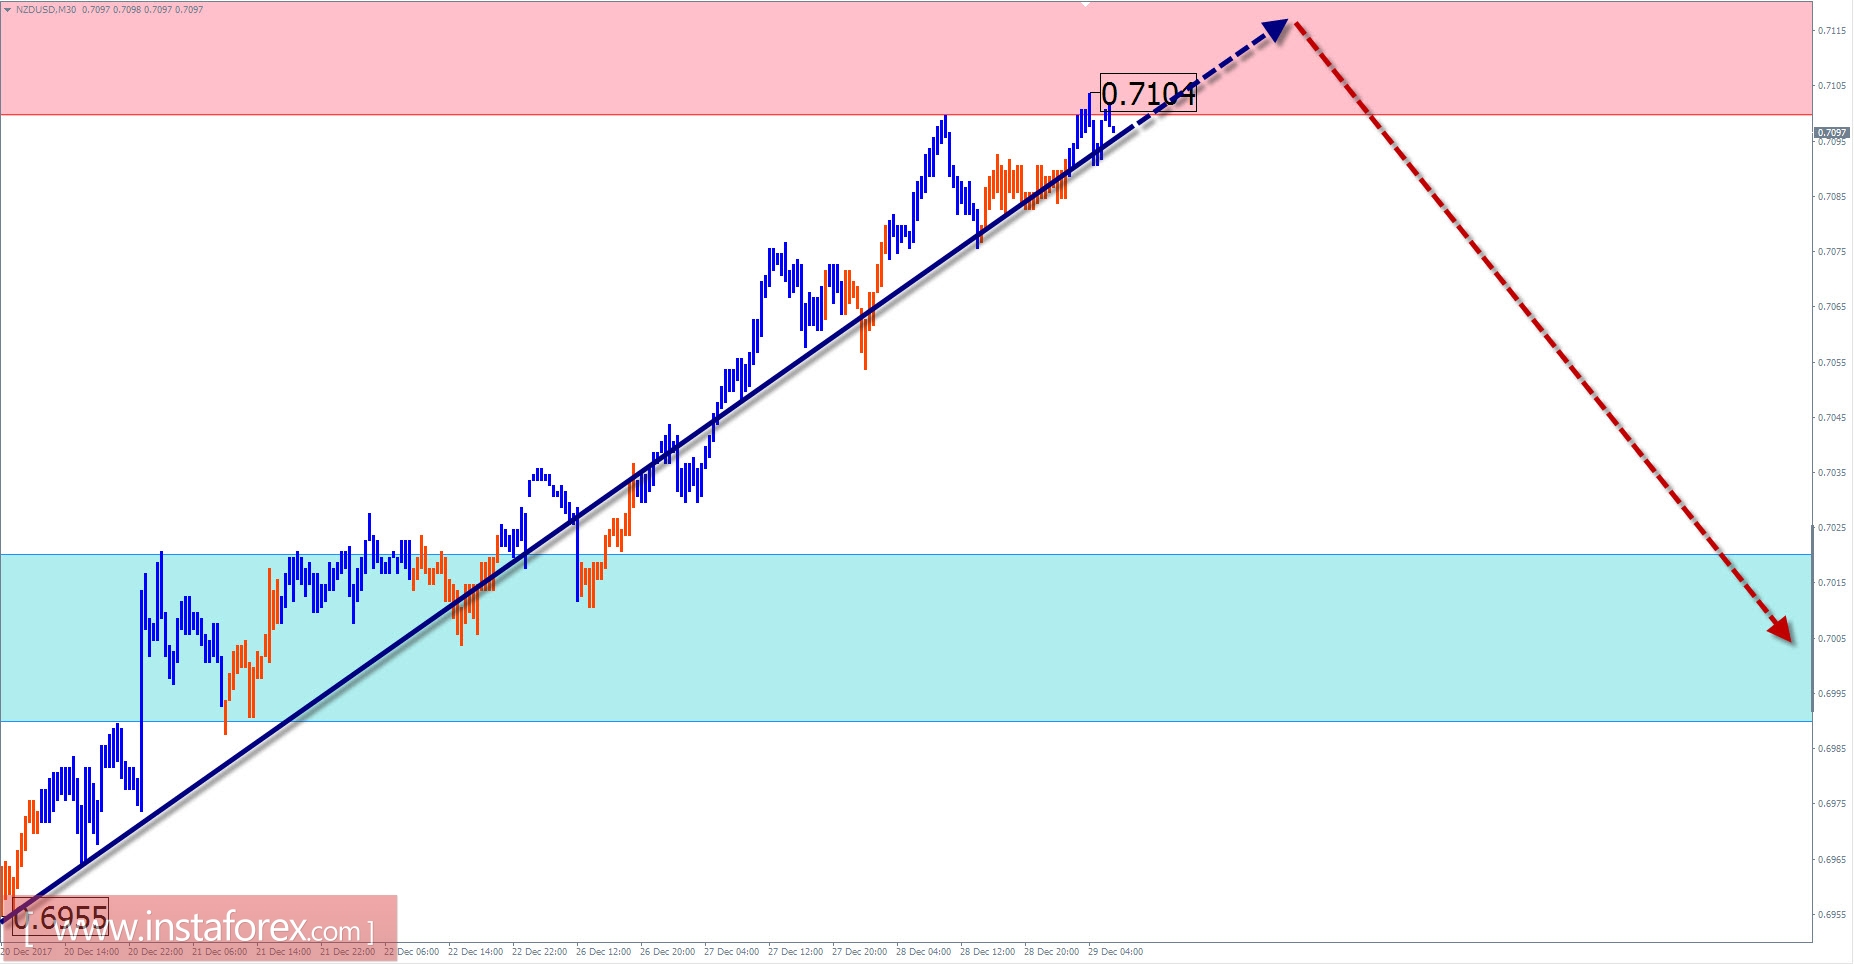
Review and Forecast for NZD / USD pair
On the chart of the New Zealand dollar main pair, the direction of price movement sets a downward wave since July 27. After contact with the powerful support zone in late October, the price began adjusting. Over the past two months, quotes were able to reached the boundaries of the preliminary target zone, where the probability of ending the entire correction has sharply increased. The completion of the structure of the bullish area and the presence of a large-scale resistance level in the zone tend to favor this option.
The obstacle to the immediate change in the exchange rate.
Today, a flat movement is expected after the expected pressure on the resistance zone, where the price is waiting for the turn and the beginning of the decline.
Boundaries of resistance zones:
- 0.7100 / 0.7130
Boundaries of support zones:
- 0.7020 / 0.6990
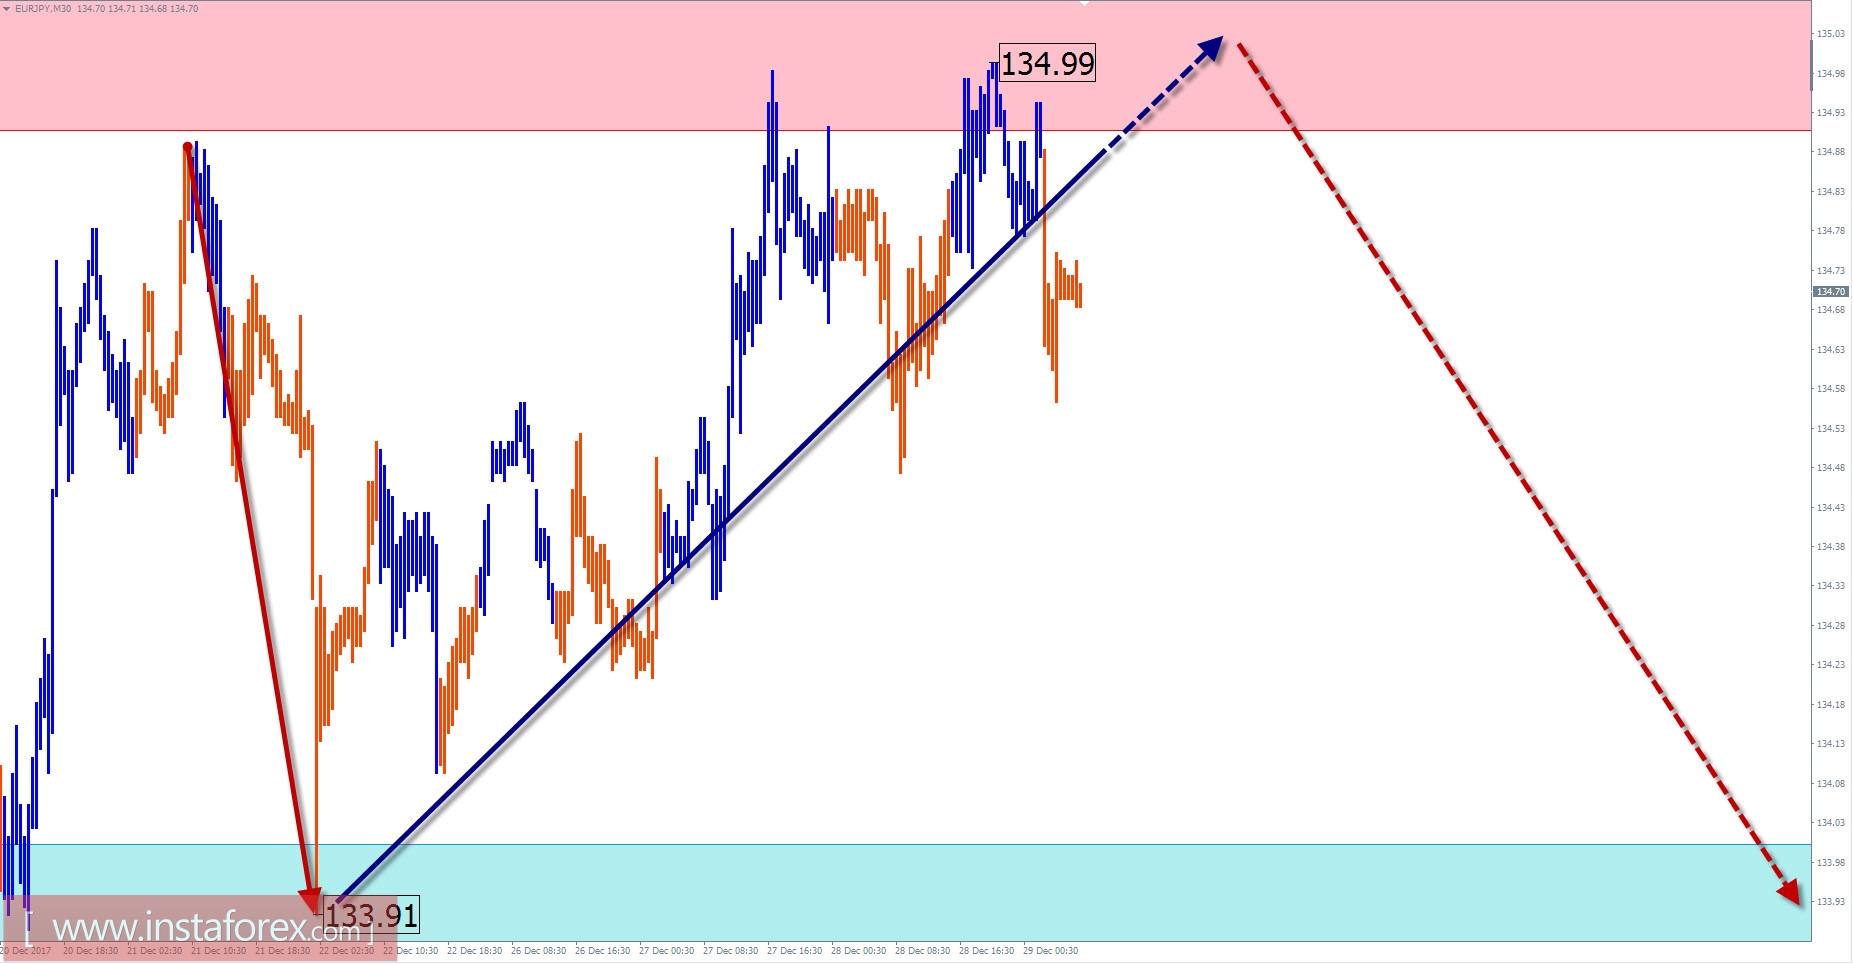
EUR / JPY pair outlook
On the daily scale of the cross-over EUR/JPY pair chart, a distinct upward zigzag has been traced since June last year. The last part of the wave (C) has an impulsive character of motion. From the end of September, an intermediate correction is formed in the side price corridor, which is close to completion. The preliminary calculation of the target zone allows the expectation of at least 3 price figures to move up.
In the upcoming trading sessions, a downward motion vector is expected, with a generally flat nature of the fluctuations. The active phase is more likely to occur in the second half of the day. The zone of support indicates the main part in the completion of the daily course of the pair.
Boundaries of resistance zones:
- 134.90 / 135.20
Boundaries of support zones:
- 134.00 / 133.70
Explanations of the figures:
For simplified wave analysis, a simple waveform is used that combines 3 parts namely A, B, and C. All types of correction are created and most of the impulses can be found in these waves. Every time frame is considered and the last incomplete wave is analyzed.
The areas marked on the graphs indicate the probability of a change in the direction of motion has significantly increased as calculated in the areas. Arrows indicate the wave counting following the technique used by the author. A solid background of the arrows signifying the structure has been formed while the dotted one means the expected wave motion.
Attention: The wave algorithm does not take into account the duration of the movement of tools in time. The forecast is not a trading signal! To conduct a bargain, you need to confirm the signals used by your trading systems.
InstaForex analytical reviews will make you fully aware of market trends! Being an InstaForex client, you are provided with a large number of free services for efficient trading.

