 Permanecer
Condições de Negociações
Ferramentas


Over the past three years, the US dollar quotes move according to the algorithm of the descending figure of the "expanded flat". The beginning of the final part (C) in the past year caused a dramatic fall in the rate. The wave structure model still does not demonstrate completeness. Quotes have reached the nearest reference level of support, which can trigger a correction of the main trend. In addition to the nearest level, the potential area for a reversal could be the next support zone around the 85th figure.
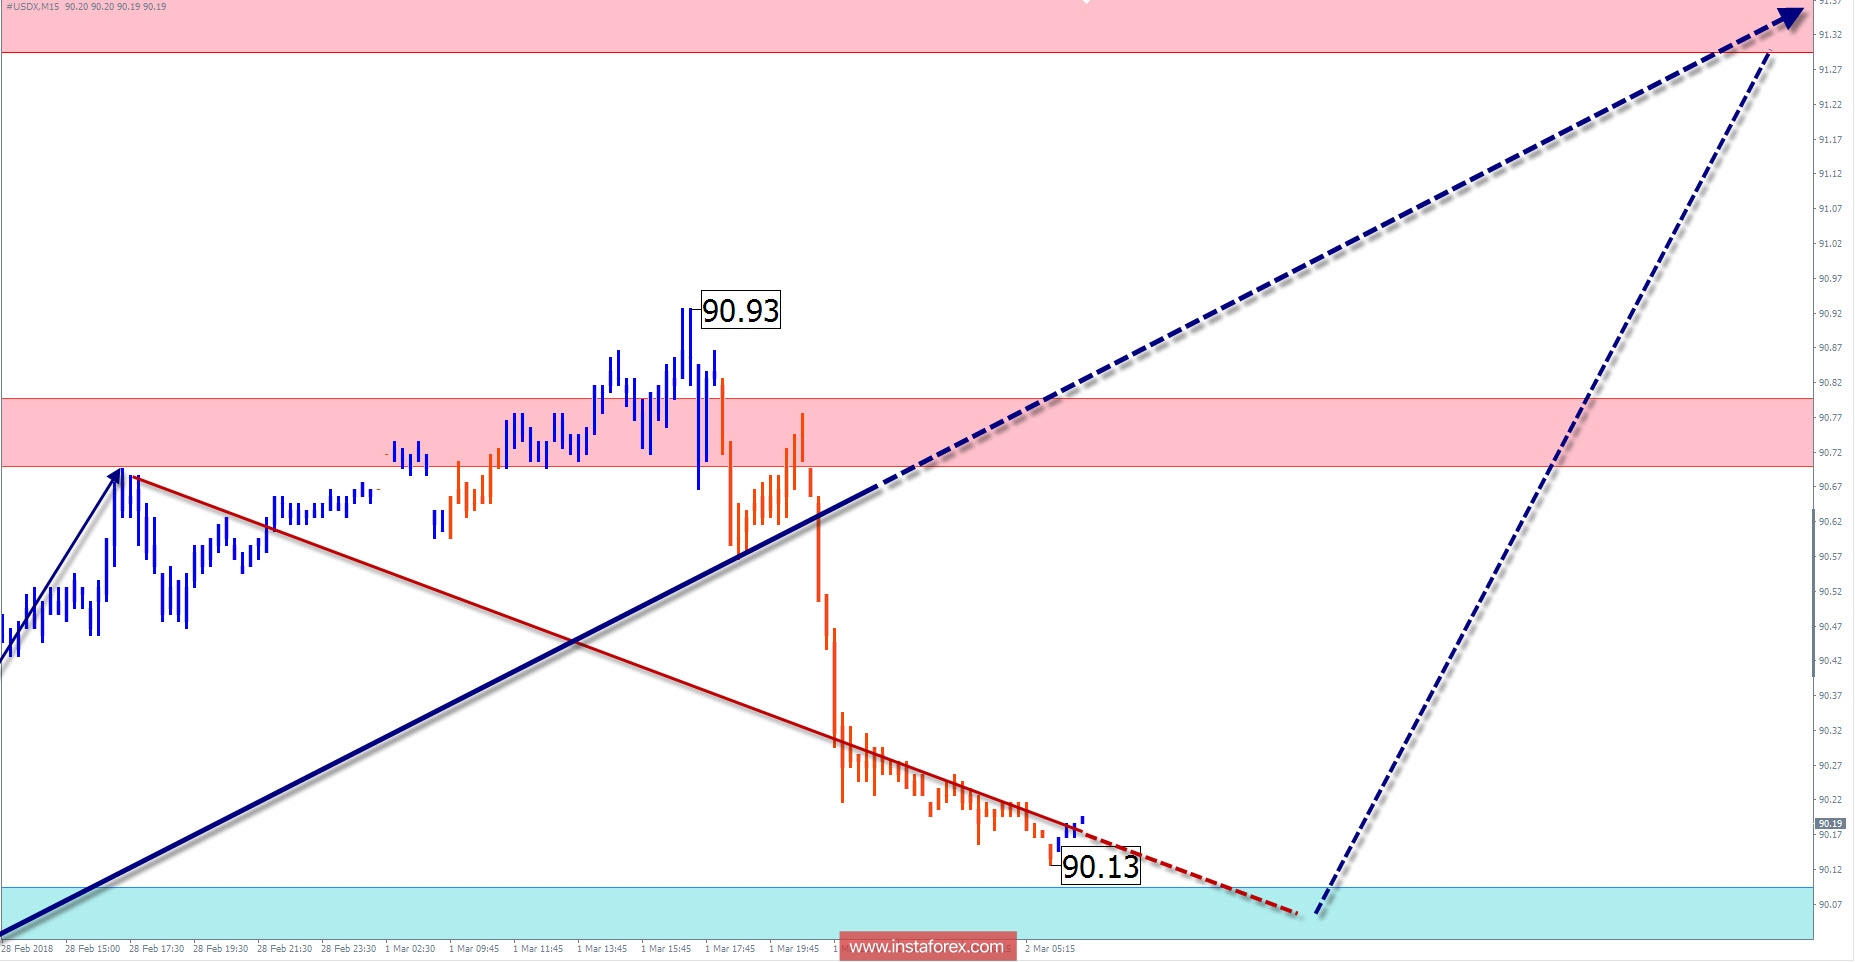
All throughout the past month of the correction section of the graph, the growth boundary is the lower boundary of the expanding channel of the index extremum.
Today, the upward movement of the index movement is expected to resume. By the end of the day, an impulse can be ruled out up to the distant zone of resistance.
Boundaries of resistance zones:
- 90.70 / 80
- 91.30 / 40
Boundaries of support zones:
- 90.10 / 90.00
Explanations to the figures: For simplified wave analysis, the simplest type of wave is used in the form of a zigzag, combining 3 parts (A; B; C). Of these waves, all kinds of correction are composed and most of the impulses. At each time frame, the last, incomplete wave is analyzed.
The areas marked on the graphs are indicated by the calculation areas, where the probability of a change in the direction of motion is significantly increased. Arrows indicate the wave counting according to the technique used by the author. The solid background of the arrows indicates the structure formed, the dotted one indicates the expected wave motion.
Attention: The wave algorithm does not take into account the duration of the tool movements in time. The forecast is not a trading signal! To conduct a trade transaction, you need to confirm the signals of your trading systems
* The presented market analysis is informative and does not constitute a guide to the transaction.
InstaForex analytical reviews will make you fully aware of market trends! Being an InstaForex client, you are provided with a large number of free services for efficient trading.


