 Permanecer
Condições de Negociações
Ferramentas


On the daily chart of the major pair "kiwi" dollar against the US currency, the prevailing direction of the price movement was determined by the unfinished wave structure that started in August 2015. In November of last year, the correctional phase (B) was completed. After that, the ascending segment started which gave rise to the final part (C). In this wave, respectively, the descending section which began in February, forms the middle part of the structure.
In the next trading sessions, a short-term price hike is possible and the course is expected to change. Price reduction has a downward potential in the area of 3 price figures. Further decline cannot be ruled out completely, but unlikely to happen.
Boundaries of resistance zones:
- 0.7350 / 0.7400
Boundaries of support zones:
- 0.7100 / 0.7050
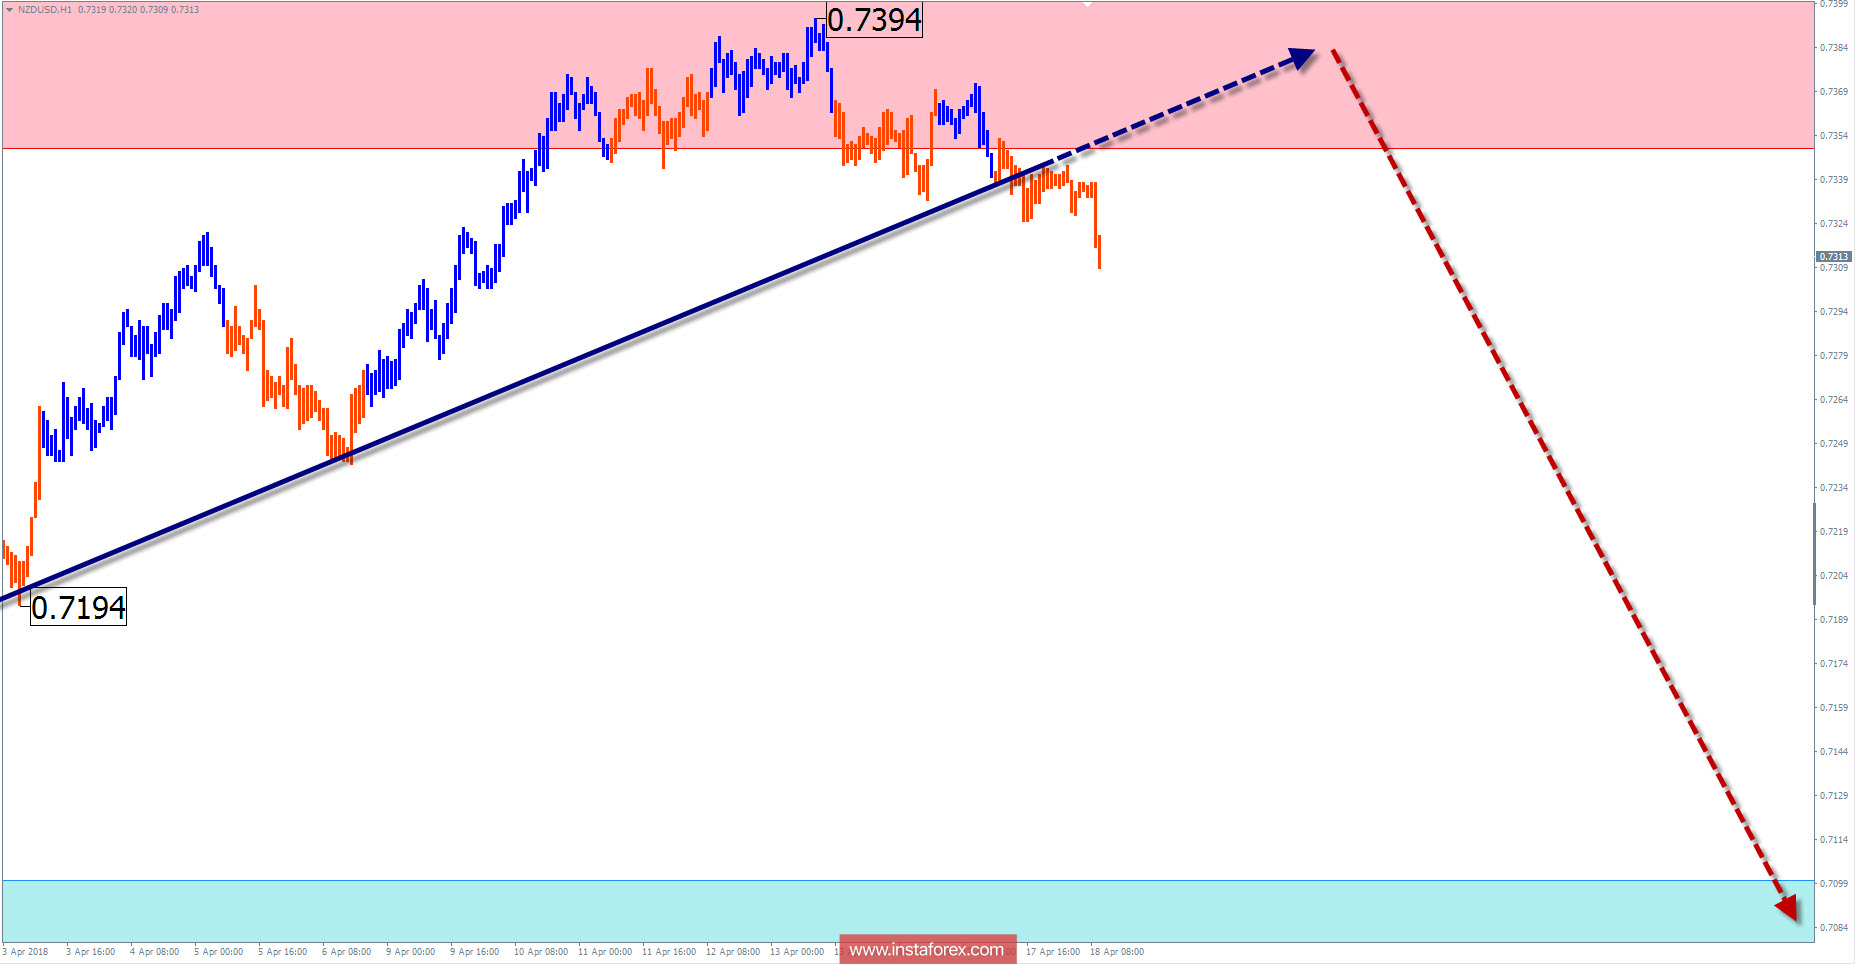
Explanations to the figures: For simplified wave analysis, the simplest type of wave is used in the form of a zigzag, combining 3 parts (A; B; C). Of these waves, all kinds of correction are composed and most of the impulses. At each time frame, the last, incomplete wave is analyzed.
The areas marked on the graphs are indicated by the calculation areas, where the probability of a change in the direction of motion is significantly increased. Arrows indicate the wave counting according to the technique used by the author. The solid background of the arrows indicates the structure of the formation, the dotted one indicates the expected wave motion.
Attention: The wave algorithm does not take into account the duration of the tool movements in time. The forecast is not a trading signal! To conduct a trade transaction, you need to confirm the signals of your trading systems.
* The presented market analysis is informative and does not constitute a guide to the transaction.
InstaForex analytical reviews will make you fully aware of market trends! Being an InstaForex client, you are provided with a large number of free services for efficient trading.


