 Permanecer
Condições de Negociações
Ferramentas


The daily scale of the Aussie / yen cross pair pattern from June 2016 shows a trend towards a rise in the exchange rate. The ascending zigzag is clearly traced, in which the average, corrective part (B) is being formed. By some indications, the bearish part of the wave entered the final phase. Calculating the potential of the down stroke indicates a sufficiently high probability of re-attaining the local low of the beginning of the entire wave.
Over the past 2 months from the upper boundary of the oncoming zone of a potential reversal, the price formed a correctional plane. The likelihood of further complication of correction with a break through the boundaries of the resistance zone is estimated as minimal.
The upcoming wave is expected to end in the coming week. Further, cross traffic is likely in the side price corridor. The repeated depreciation should lead the quotes of the pair to re-contact with the support zone.
The boundaries of resistance zones:
- 84.10 / 84.60
The boundaries of support zones:
- 81.30 / 80.80
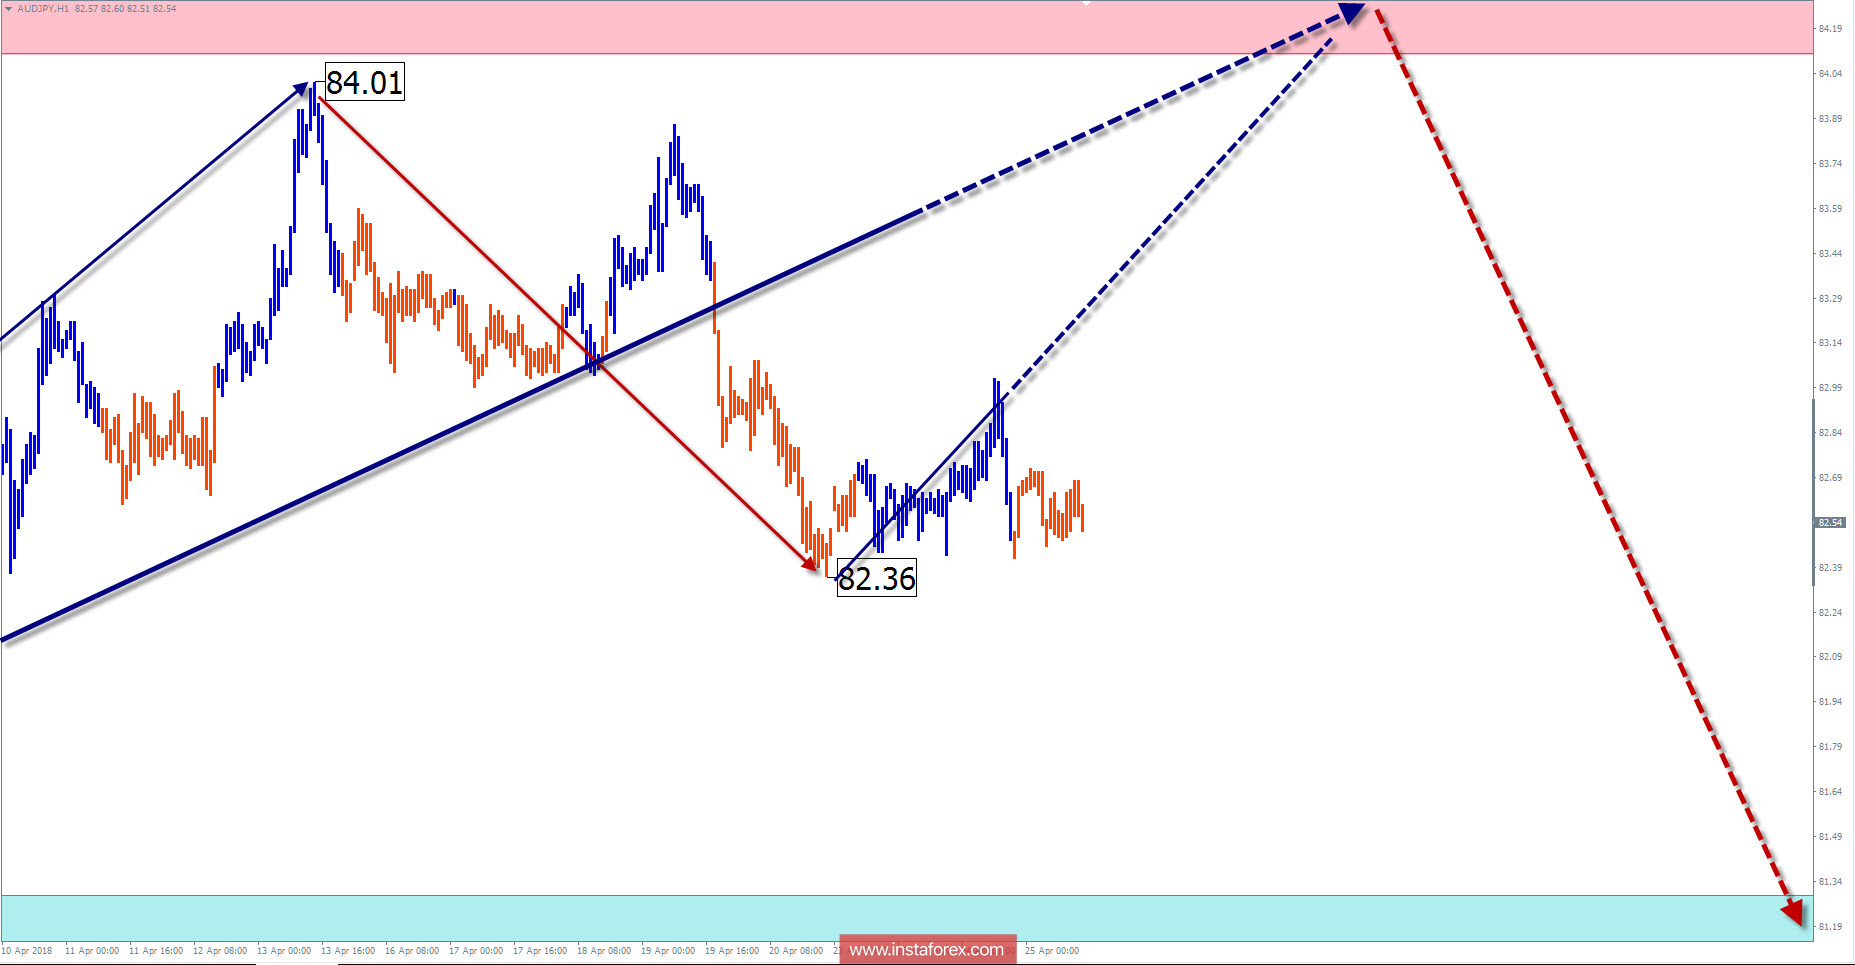
Explanations to the figures: For simplified wave analysis, the simplest type of wave is used in the form of a zigzag, combining 3 parts (A; B; C). Of these waves, all kinds of correction are composed and most of the impulses. At each time frame, the last, incomplete wave is analyzed.
The areas marked on the graphs are indicated by the calculation areas, where the probability of a change in the direction of motion is significantly increased. Arrows indicate the wave counting according to the technique used by the author. The solid background of the arrows indicates the structure formed, the dotted one indicates the expected wave motion.
Attention: The wave algorithm does not take into account the duration of the tool movements in time. The forecast is not a trading signal! To conduct a trade transaction, you need to confirm the signals of your trading systems.
InstaForex analytical reviews will make you fully aware of market trends! Being an InstaForex client, you are provided with a large number of free services for efficient trading.

