 Permanecer
Condições de Negociações
Ferramentas


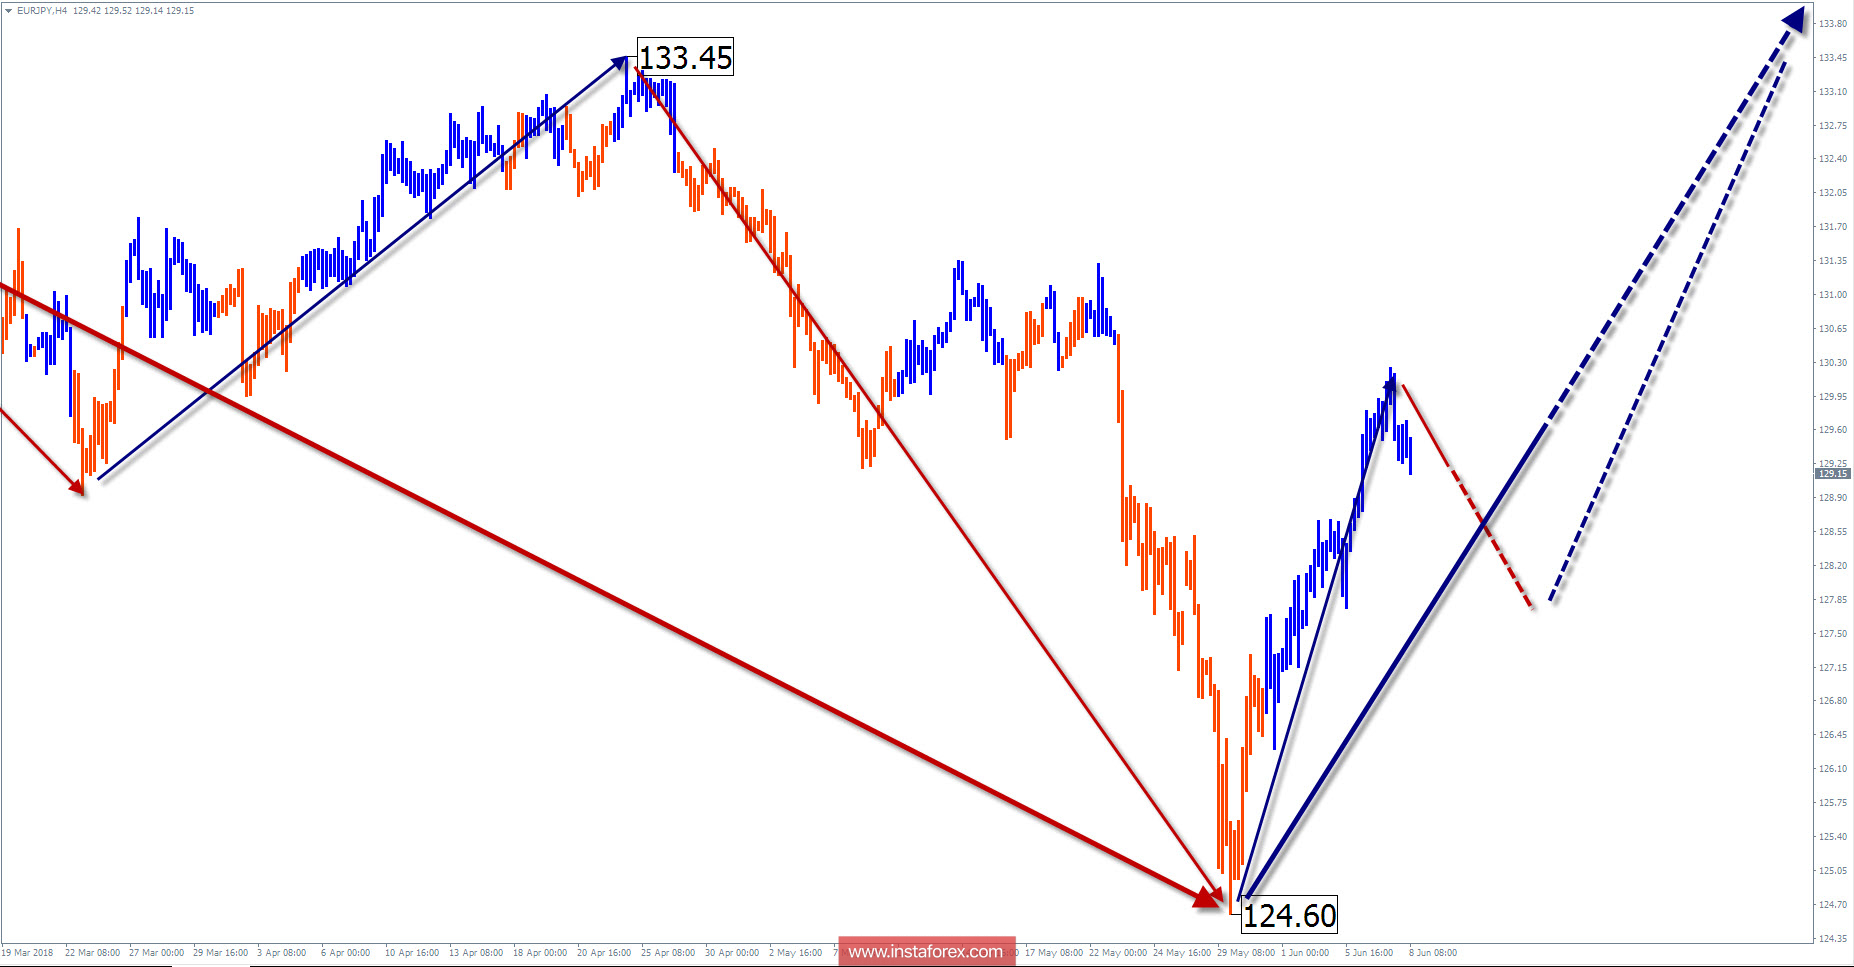
Wave picture of the H4 chart:
The direction of the trend movement from February 2 directed at the "south" of the chart. In a larger-scale wave timeframe, the site takes the place of the final part of the correction. The proportions of the internal parts of the wave are reached.
The wave pattern of the H1 graph:
The last wave of this scale is counting from the end of February. In the senior TF model, this section completes the descending zigzag. The quotes reached the preliminary target zone, from which, the development of oncoming traffic began.
The wave pattern of the M15 chart:
The upward wave of May 29 has a very high wave potential, exceeding the level of the pullback in the previous bearish wave. In the coming days, we can expect a short-term pullback, after which the growth will continue.

Recommended trading strategy:
Sales are not recommended. The potential for price growth is very high. For all trading styles in the settlement support area, it is recommended to track purchase signals.
Resistance zones:
- 132.00 / 132.50
Support zones:
- 128.50 / 128.00
Explanations to the figures:
A simplified wave analysis uses a simple waveform, in the form of a 3-part zigzag (ABC). The last incomplete wave for every time frame is analyzed. Zones show the calculated areas with the greatest probability of a turn.
Arrows indicate the counting of wave according to the technique used by the author. The solid background shows the generated structure and the dotted exhibits the expected wave motion.
Attention: The wave algorithm does not take into account the duration of the tool movements in time. To conduct a trade transaction, you need to confirm the signals used by your trading systems.
InstaForex analytical reviews will make you fully aware of market trends! Being an InstaForex client, you are provided with a large number of free services for efficient trading.

