 Permanecer
Condições de Negociações
Ferramentas


EUR / USD pair
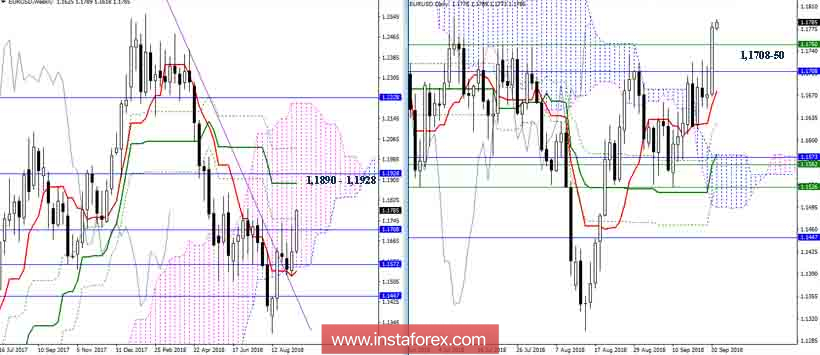
Players on the rise could finally rise above the consolidation zone, formed under the lower boundaries of the key lines of resistance (1.1708-50). The main task now is to confirm the breakdown of resistance at the weekly timeframe, as well as the transformation of recent resistance into a reliable support. Fastening above 1.1750 (weekly Fibo Kijun) opens the way to the following upward directions in the area of 1.1890 - 1.1928 (weekly Kijun + monthly Tenkan).
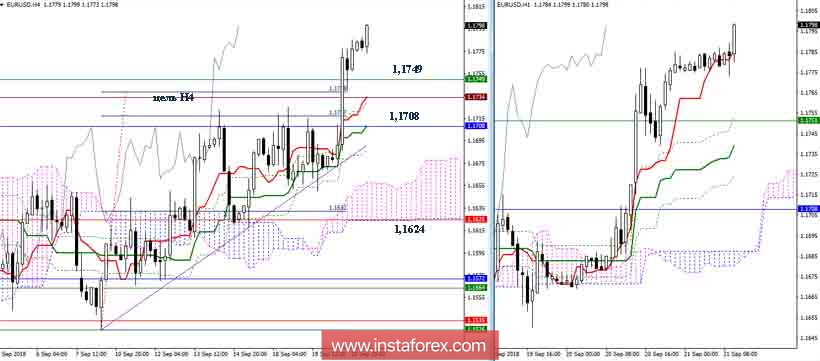
Yesterday, the support zone of (1.1671-59), whose breakdown could change the balance of power, was directly under the current location. Nevertheless, the players on the rise managed to keep the gold H4 cross and work in the bull zone relative to the H1 cloud. The result was a breakdown of the key resistance zone (1.1708-50). Today we close the week and the result must be kept in order to develop further prospects.

To complement and strengthen the technical picture of the EUR/USD pair, consider the findings of Pivot Points and Moving Average (120). These technical indicators are in solidarity with the fact that the benefits currently belong to the players to rise as the long-term trend continues to be directed upwards. The key support zone is located today between 1.1743 (central pivot) and 1.1702 (S1), which is exactly as accurate as the indicator of Ichimoku. Among the additional supports today, we can note the levels of 1.1627 (S2) and 1.1586 (S3). Resistance of the current day is located at 1.1818 (R1) - 1.1859 (R2) - 1.1934 (R3).
Indicator parameters:
all time intervals 9 - 26 - 52
Color of indicator lines:
Tenkan (short-term trend) - red,
Kijun (medium-term trend) - green,
Fibo Kijun is a green dotted line,
Chikou is gray,
clouds: Senkou Span B (SSB, long-term trend) - blue,
Senkou Span A (SSA) - pink.
Color of additional lines:
support and resistance MN - blue, W1 - green, D1 - red, H4 - pink, H1 - gray,
horizontal levels (not Ichimoku) - brown,
trend lines - purple.
InstaForex analytical reviews will make you fully aware of market trends! Being an InstaForex client, you are provided with a large number of free services for efficient trading.


