 Permanecer
Condições de Negociações
Ferramentas


The pair has been moving up all last week, but after testing the pullback level of 61.8% - 1.1103 (blue dotted line), the price went down and closed below the support line of 1.1063 (red bold line). The price in the coming week will try to continue moving up.
Trend analysis.
This week, the price will move up with the first target of 1.1103 - a pullback level of 61.8% (blue dotted line). If you break through the top of this level, the next top target will be a pullback level of 76.4% - 1.1128 (blue dotted line).
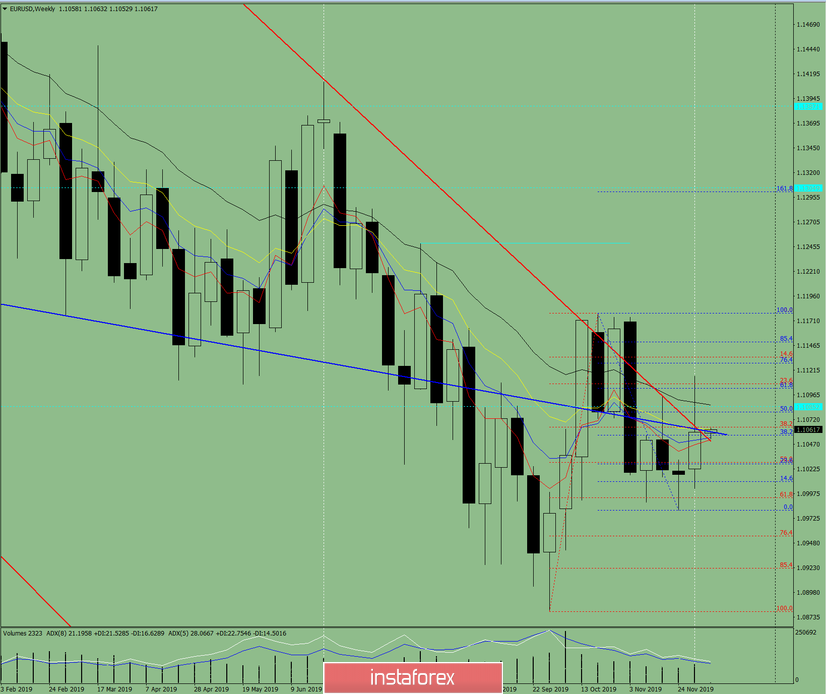
Fig. 1 (weekly chart).
Complex analysis:
- Indicator analysis - up;
- Fibonacci levels - up;
- Volumes - up;
- Candle analysis - up;
- Trend analysis - neutral;
- Bollinger Bands - down;
- Monthly chart - up.
The conclusion of the complex analysis is an upward movement.
The total result of calculating the candle of the EUR / USD currency pair according to the weekly chart: the price of the week is likely to have an upward trend, with the absence of the first lower shadow of the weekly white candlestick (Monday - up) and the absence of the second upper shadow (Friday - up).
The first target when moving up 1.1103 - a pullback level of 61.8% (blue dotted line). If you break through the top of this level, the next top target will be a pullback level of 76.4% - 1.1128 (blue dotted line).
The unlikely lower scenario is the first lower target of 1.0981 - the lower fractal (blue dotted line). If successful, the next lower target - a pullback level of 76.4% - 1.0955 (red dotted line).
InstaForex analytical reviews will make you fully aware of market trends! Being an InstaForex client, you are provided with a large number of free services for efficient trading.


