 Permanecer
Condições de Negociações
Ferramentas


Hello!
The strengthening of the US dollar across the entire spectrum of the market at the auction on February 3-7 did not bypass the dollar/franc currency pair. In this article, all attention will be focused on the technical picture that is observed for this currency pair. We will consider as many USD/CHF charts as possible and, if we find interesting and technically sound options for opening trading positions, we will outline a trading plan for this currency pair.
Weekly
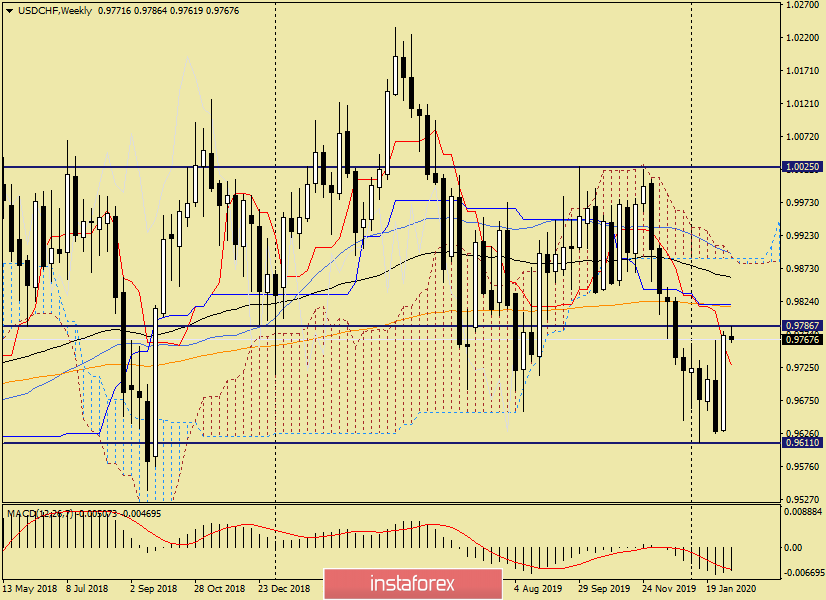
Since the last week recently closed, and the current one is at its beginning, I will start the analysis with a weekly timeframe.
It is immediately evident that the pair did not reach the previous lows last week and turned to strengthen, which turned out to be more than impressive. Another point worth paying attention to is the support area near 0.9611. Precisely, before reaching this level, there was a reversal in the north direction.
At the moment of writing this article, the market for USD/CHF is resting. There is no movement or body of the candle at the moment of writing. I think we will soon find out that this is a consolidation before continuing the recovery or waiting for the speech of the Chairman of the Federal Reserve System (FRS) with the semi-annual report on monetary policy. Usually, this event has a noticeable reaction to financial markets. Let's see what happens this time.
In my opinion, USD/CHF has reason to continue strengthening after such an impressive bullish candle. If this happens, the nearest targets on the weekly chart will be the 200 exponential moving average and the Kijun line of the Ichimoku indicator, which are right under the strong technical level of 0.9820. In the case of stronger growth, the pair will head to 0.9860 (89 EMA) and 0.9890, where 50 MA and both borders of the Ichimoku cloud are located.
If the market chooses a downward scenario, the nearest target will be the Tenkan at 0.9728. The passage of this line may increase the pressure on the pair and open the way towards the past lows at 0.9628.
Daily
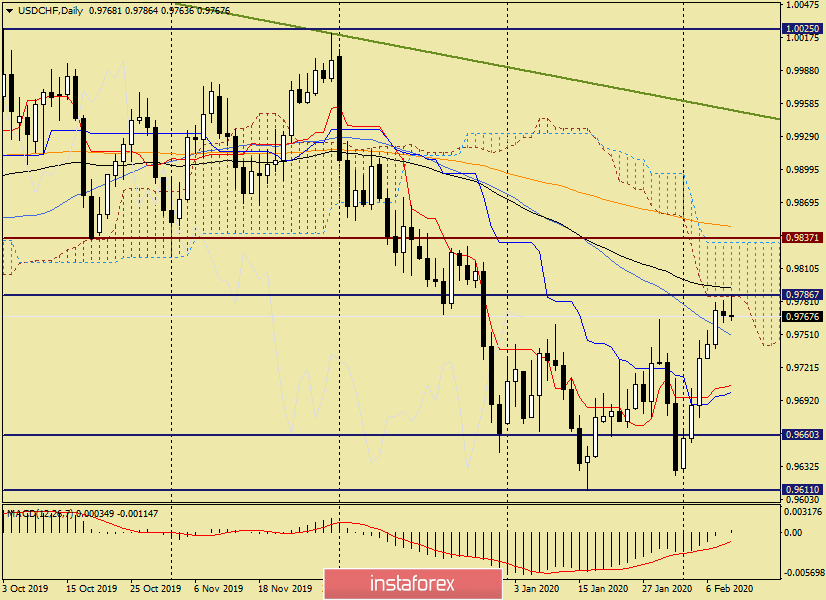
A candle appeared on the daily chart yesterday, which can be considered a reversal in its essence. We see that attempts to continue growth are limited by the lower border of the Ichimoku indicator cloud, which acts as a strong resistance.
Here, the situation is not as clear as on weekly. If the pair is unable to enter the Ichimoku cloud and another reversal candle appears, you should try selling with the nearest target at 0.9750. More distant targets are located in the area of 0.9710-0.9700, where the Tenkan and Kijun lines are located, respectively.
If the bulls on the pair still manage to enter the limits of the Ichimoku cloud and gain a foothold in it, on the rollback to its lower border, you can try to buy the dollar/franc with goals at 0.9820-0.9830. However, you should not discount any other exhibitor. In order to gain a foothold within the cloud, you need a true breakdown of the 89 EMA, which will provide serious resistance to growth attempts.
H4
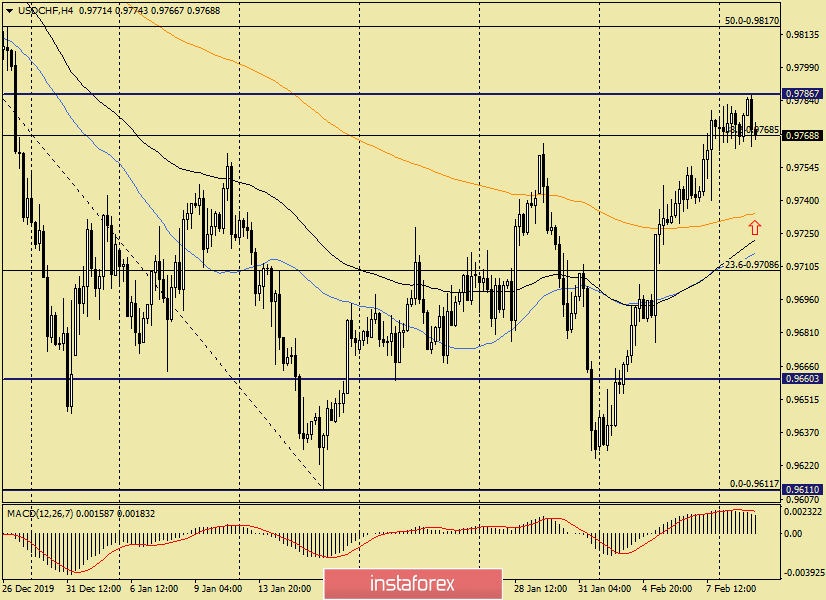
At the 4-hour chart, the pair performed a corrective pullback to 38.2 Fibo from a decline of 1.0022-0.9611. What's next?
In my opinion, there are two most likely scenarios. Correction to the area of 0.9735-0.9715, where the used moving averages are concentrated. From the selected zone, it is possible to resume growth. If this happens, it is a sin not to buy at such attractive prices.
The second scenario is a continuation of the rise from current prices. In this case, I can recommend buying on the breakdown of the resistance of 0.9787, but this is only for those who use the breakdown strategy.
For the rest, it is better to wait for the breakdown of the current local resistance at 0.9787, consolidate above this level, and buy on the rollback to it.
There are no generated signals for opening short positions at the moment. You need to wait until they appear, and then sell.
Good luck!
InstaForex analytical reviews will make you fully aware of market trends! Being an InstaForex client, you are provided with a large number of free services for efficient trading.


