 Permanecer
Condições de Negociações
Ferramentas


Hello, colleagues!
Recently, weekly trading for major currency pairs ends in different ways and the past week was no exception. In addition to the Swiss franc and the euro, other major currencies declined against the US dollar.
The following macroeconomic data from Europe and the United States, the Fed minutes, and the situation with the coronavirus epidemic had an impact on the EUR/USD trading on February 17-21. Before moving on to the technical picture of the main currency pair, let's highlight the most important events of this week that may affect the price dynamics of the euro/dollar.
Eurozone: IFO current conditions index and German GDP, speech by ECB President Christine Lagarde, consumer price index in the eurozone and data on the German labor market.
USA: economic activity index from the Federal Reserve of Chicago, consumer confidence indicator, initial applications for unemployment benefits, orders for durable goods, GDP, as well as data on personal income and spending of Americans.
You can find out more about these and other events in the economic calendar. Now it's time to move on to the technical analysis of the main currency pair, and let's start with the results of last week.
Weekly
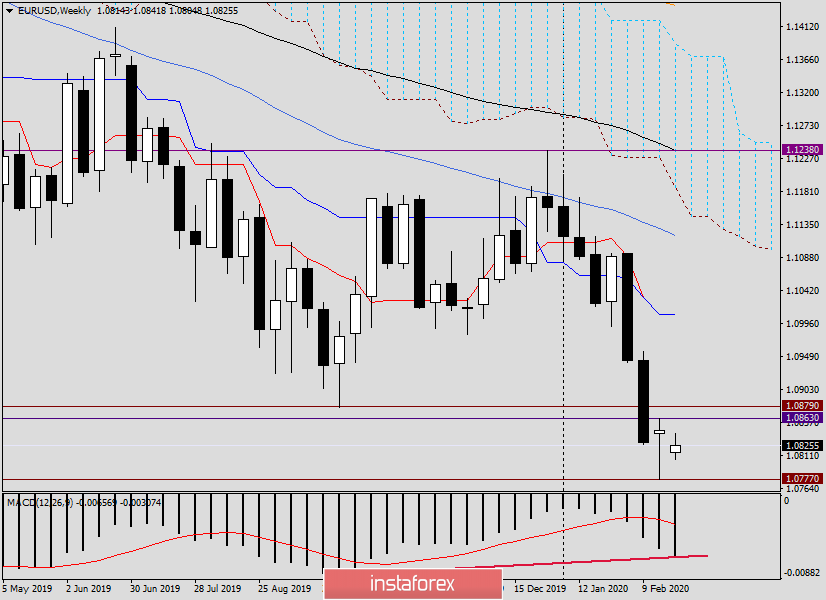
A candle that appeared last week can be considered a "hammer", while the body (albeit very small) is bullish. The "hammer" is considered a reversal model of graphical analysis but requires confirmation in the form of a subsequent bullish candle.
If a white rising candle appears at the end of the week, we can assume that the market has started working out a reversal candle model "hammer". You should also pay attention to the bullish divergence of the MACD indicator, which is an additional signal of a possible strengthening of the euro/dollar.
If a bearish (black) candle is formed, especially with the closing price below the previous lows of 1.0777, the signal of a reversal for a corrective recovery is likely to be considered broken.
Thus, the current range in which EUR/USD is traded can be considered 1.0863-1.0777. I believe that the direction in which the pair leaves this range will determine its future direction. However, we should not forget about the broken support level of 1.0879, so we will consider 1.0863-1.0879 as a resistance zone.
Daily
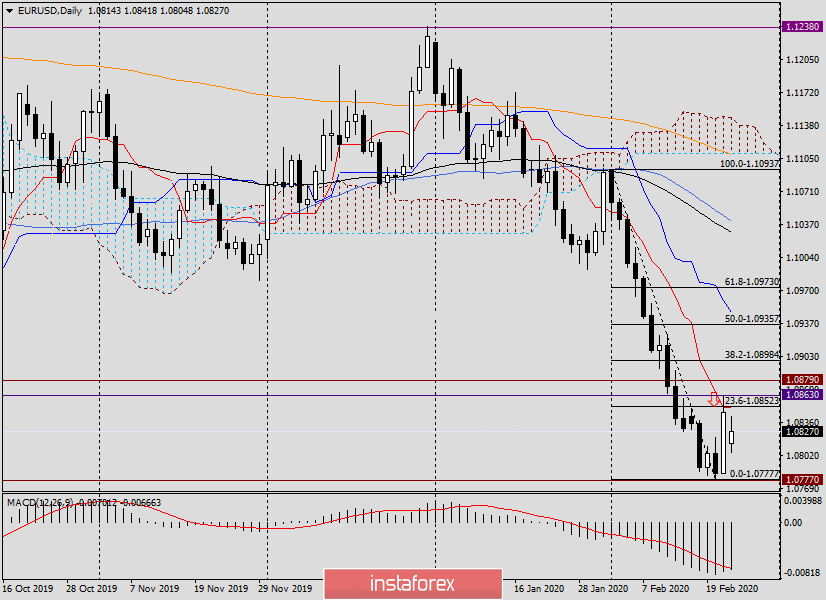
On Friday, the pair strengthened significantly and reached the Tenkan line of the Ichimoku indicator on the daily chart, from which a possible reversal was expected to resume the downward movement.
Indeed, EUR/USD opened with a price gap down. I believe that this reaction of market participants was influenced by the spread of coronavirus in Italy, where the number of infected people is about 150, and three have already died from this epidemic. As has been repeatedly noted, the situation with the coronavirus supports the US dollar, although it would be more logical to assume the strengthening of the Swiss franc and the Japanese yen. However, we decide the market in our own way, and there is nothing to be surprised at.
If you go back to the technical picture on the daily chart, the nearest resistance is represented by the Tenkan line, the 23.6 Fibo level from the fall of 1.094-1.0777, and the price zone of 1.0863-1.0879.
In my opinion, growth above Friday's highs of 1.0863 and the closing of trading above this level will already be a signal for a subsequent rise and will confirm this return above the broken support level of 1.0879.
In my personal opinion, in this situation, a bearish scenario is less likely. It will become real only after the breakdown of the support of 1.0777 and the closing of trading below.
According to trading recommendations, it is now difficult to offer something real. There is a non-flooded bearish gap and the current highs of today's Asian session trading at 1.0842. If the euro bulls can raise the rate above 1.0842, close the gap and form a bullish candle, the assumptions of possible growth will strengthen. Tomorrow we will analyze a smaller time interval. Taking into account the closing of today's trading, we will try to find points for entering the market.
Have a nice day!
InstaForex analytical reviews will make you fully aware of market trends! Being an InstaForex client, you are provided with a large number of free services for efficient trading.


