 Permanecer
Condições de Negociações
Ferramentas


The pair traded downward on Friday and tested 1.2572 - a 23.6% pullback level (red dotted line), but did not manage to break through it. After that, the price rolled back up then tested the upper fractal 1.2670 (red dotted line), but again failed to break this strong level and rolled back down. Today, the upward trend is likely to continue. Nothing is expected for economic calendar news.
Trend analysis (Fig. 1).
Today, the upward trend may continue from the level of 1.2624 (closing of the Friday afternoon candle) with the target at the upper fractal 1.2670 (red dashed line). If this line is reached, the upward trend may continue with the next target at the historical resistance level of 1.2752 (white dashed line).
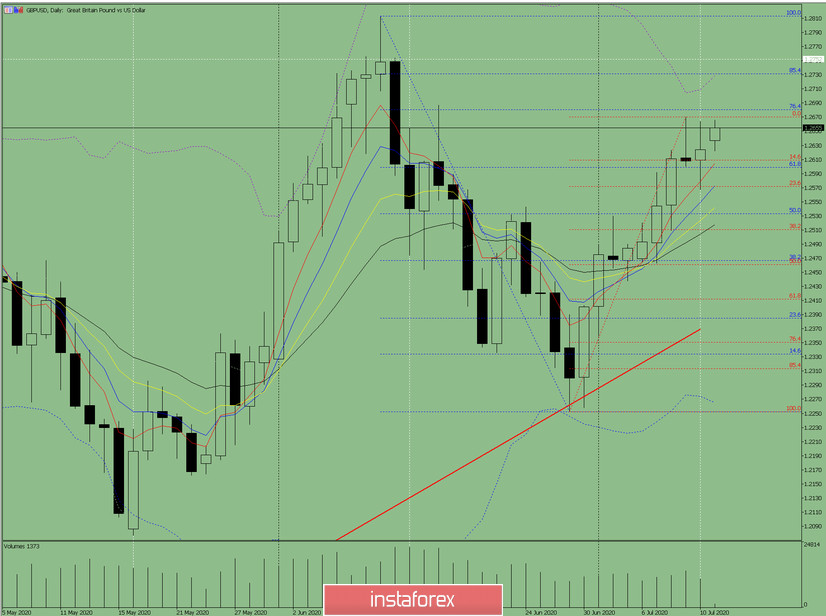
Fig. 1 (daily chart).
Comprehensive analysis:
- Indicator analysis - up;
- Fibonacci levels - up;
- Volumes - down;
- Candlestick analysis - up;
- Trend analysis - up;
- Bollinger Lines - up;
- Weekly schedule - up.
General conclusion:
Today, the price may begin to move upward with the target at the upper fractal 1.2670 (red dashed line). If this line is reached, it is possible the upward trend may continue with the next target at the historical resistance level of 1.2752 (white dashed line).
Another possible scenario is a downward trend from the level of 1.2624 (closing of the Friday afternoon candle) with the first target at 1.2533 - a 50% pullback level (blue dashed line).
InstaForex analytical reviews will make you fully aware of market trends! Being an InstaForex client, you are provided with a large number of free services for efficient trading.


