 Permanecer
Condições de Negociações
Ferramentas


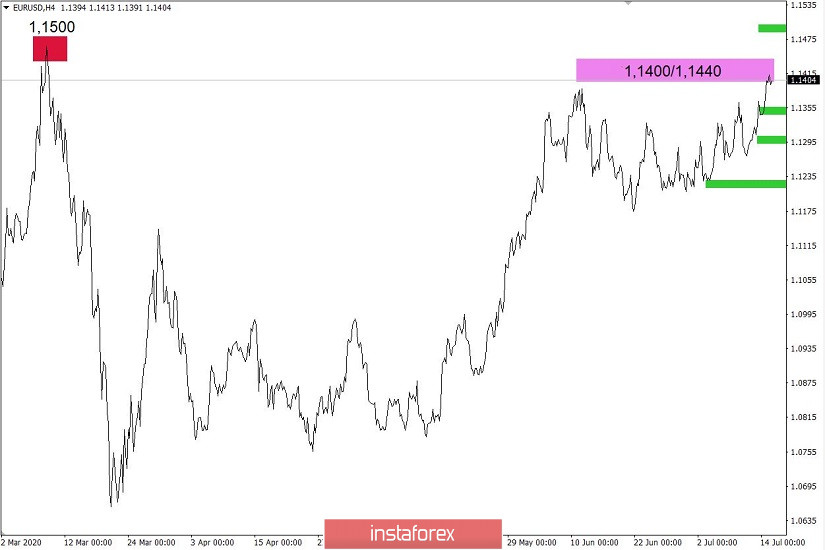
The euro/dollar currency pair still held Friday's round of long operations, as a result of which the quote came close to the local maximum of June 10 – 1.1423, where it formed a slowdown with surgical precision. In fact, we are faced with a market pattern based on which technical analysis works. In turn, traders, observing the convergence of the price with the area of interaction of trading forces 1.1400/1.1440, moved from building up long positions to reducing them due to the risk of a possible rebound.
Analyzing the past day in detail, we can see that the focus of the price below the level of 1.1350 did not last long, where there was an upward move at the beginning of the European session, on the basis of which the quote broke through a maximum on July 13, and then concentrated on the area of interaction of trade forces.
In all the existing fluctuations, as before, one can see speculative excitement, which accelerates market dynamics without undue labor.
The volatility of the past day was 83 points, which is 6% higher than the daily average.
Considering the trading chart in general terms (daily period), it is worth considering that the area of interaction between the trading forces of 1.1400/1.1440 has a maximum deviation of 1.1500, which came to us from the local maximum on March 9 - 1.1496.
The news background of the past day contained data on industrial production in Europe, where the decline slowed from -28.7% to -20.9% on an annualized basis, and in monthly terms, it even increased by 12.4% in May. The factor is positive, but it is worth considering that even better results were predicted.
The market reaction to the European industrial data was in favor of the European currency.
They published the final inflation data in the United States in the afternoon, where forecasts of its growth were confirmed from 0.1% to 0.6%, which means that the Fed does not take additional measures to mitigate monetary policy, which benefits the US dollar.
The market reaction was negative, the fundamental analysis did not work, and the dollar continued to weaken. What is the reason for the discrepancy? The answer lies in the information background.
In terms of the general informational background, we have a surge of emotions caused by the noise regarding the PRC's intentions to impose sanctions against American citizens and organizations in connection with the adoption of the Law on Hong Kong Autonomy by the USA.
"The US bill maliciously denigrates the Hong Kong National Security Act, contains threats to impose sanctions on China, seriously violates international law and the basic rules of international relations, and is a gross interference in the affairs of Hong Kong and the internal affairs of China. The Chinese government strongly condemns this and strongly opposes it," the Chinese Foreign Ministry commented.
Beijing's retaliatory measures will soon follow, which means that the trade relationship, which is already bursting at the seams, may be radically "torn apart", which will lead to new duties and new restrictions.
Now that we have seen the external background, everything has fallen into place, and the reason for the weakening of the US dollar is clear.
Today, in terms of the economic calendar, we do not have the attention of statistical data on Europe and the United States, and they are not needed when we have such a strong emotional background in the market.

Further development
Analyzing the current trading chart, we see price fluctuations within the boundaries of the area of interaction of trade forces 1.1400/1.1440, where market participants have clearly reduced the volume of long positions, fearing another rebound. Although the market is subject to a strong external background, you should not remove the theory of regularity from the horizon, which "faithfully" serves as a technical analysis.
The burning forecast is that the area of 1.1400/1.1440 will still have a proper impact on the market, eventually turning the quote in the opposite direction, having something similar in dynamics, like June 10th.
At the same time, you need to have a plan "B", in case the external background continues to put pressure on the market, and speculators get out of control. In this case, price consolidation above 1.1445 may lead us to a local maximum of March 9 - 1.1496.
Based on the above information, we derive trading recommendations:
- Consider sell deals below 1.1380, in the direction of 1.1350 - 1.1300 - 1.1250.
- Consider buy deals above 1.1445, towards 1.1490.
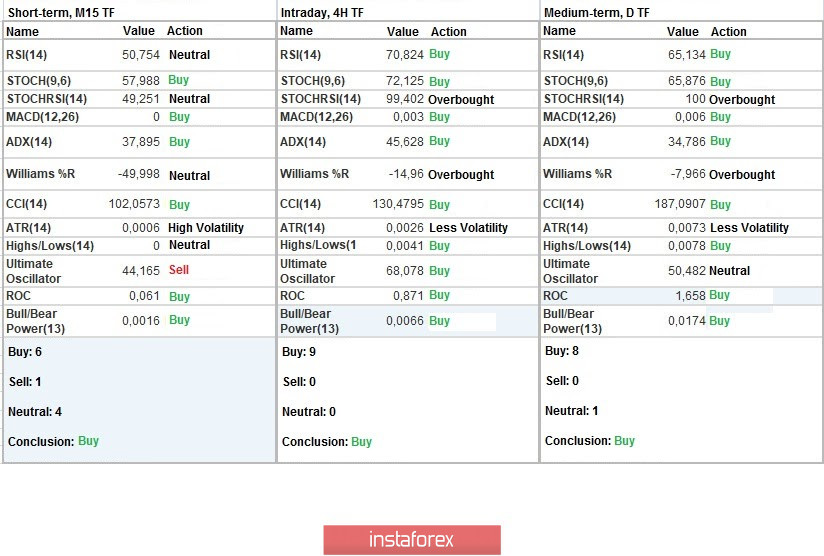
Indicator analysis
Analyzing a different sector of time frames (TF), we see that the indicators of technical instruments on the minute, hour and day periods signal a purchase, due to price fluctuations within the boundaries of the area of interaction of trade forces. In the event of a price rebound and consolidation below 1.1380, minute and hour intervals will change the signal.
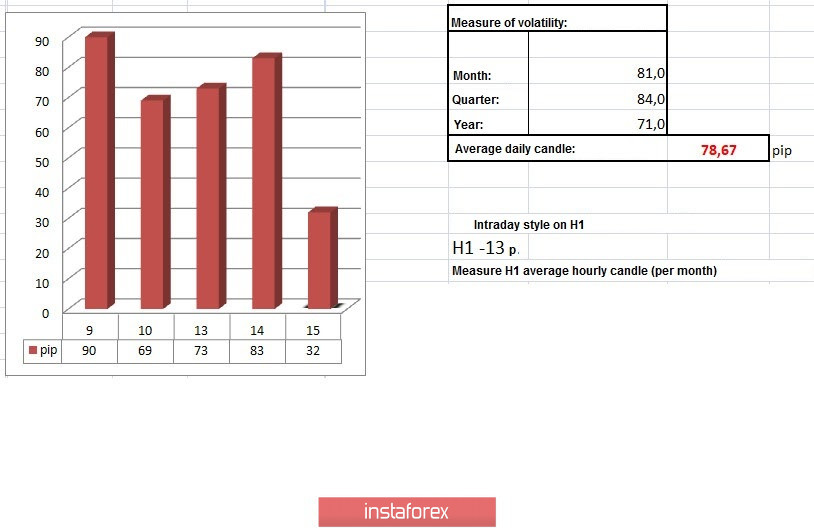
Volatility per week / Measurement of volatility: Month; Quarter; Year
Volatility measurement reflects the average daily fluctuation calculated for the Month / Quarter / Year.
(July 15 was built taking into account the time of publication of the article)
The volatility of the current time is 32 points, which is 58% lower than the daily average. It can be assumed that against the background of the external background, as well as the concentration of prices within the important price area, we are expecting another surge in activity, which will lead to increased market volatility.
Key levels
Resistance zones: 1.1400 // 1.1440 // 1.1500; 1.1650 *; 1.1720 **; 1.1850 **; 1.2100
Support zones: 1.1350; 1.1250 *; 1.1180 **; 1.1080; 1.1000 ***; 1.0850 **; 1.0775 *; 1.0650 (1.0636); 1.0500 ***; 1.0350 **; 1.0000 ***.
* Periodic level
** Range Level
*** Psychological level
InstaForex analytical reviews will make you fully aware of market trends! Being an InstaForex client, you are provided with a large number of free services for efficient trading.

