 Permanecer
Condições de Negociações
Ferramentas


The pair went to a downward trend due to the coincidence of technical and fundamental analysis last week, testing the support line at 1.2803 (white bold line) as well as 21 average EMA at 1.2806 (black thin line). Most likely, the price may go upward this week.
Trend analysis.
The price from the level of 1.2791 will move up to reach the pullback level of 50.0% up to 1.2892 (blue dotted line) for this week. If this level will be tested, it is possible to continue working up to the next upper pullback level of 61.8% up to 1.3243 (blue dotted line).
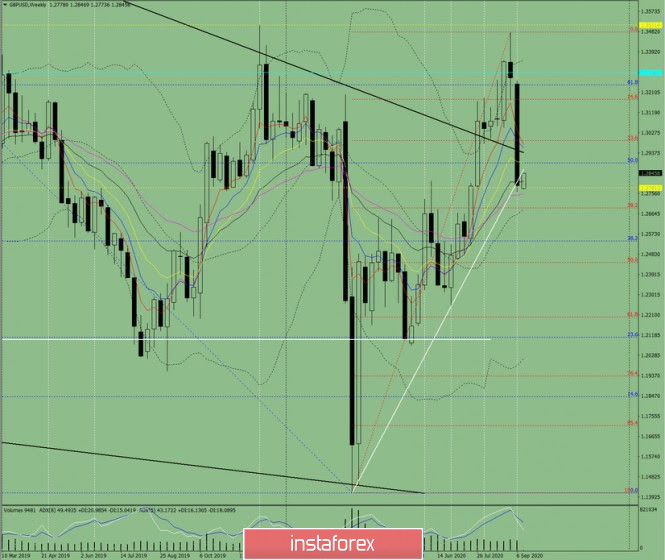
Figure 1 (weekly chart).
Comprehensive analysis:
- Indicator Analysis - Up
- Fibonacci levels - Up
- Volumes - Up
- Candle Analysis - Up
- Trend Analysis - Up
- Bollinger bands - Up
- Monthly Chart - Up
The conclusion of the complex analysis is an upward movement.
The GBP/USD currency pair total calculation candle on a weekly chart will most likely head to upward trend with the absence of the first lower shadow at the weekly white candle (Monday - up) and having a second upper shadow (Friday - down).
The first top goal is the achievement of a sliding level of 50.0% - 1.2892 (blue dotted line) and in the case of testing this level may continue running up with the goal of the next sliding the top of the level 61.8% - 1.3243 (blue dashed line).
Unlikely scenario: from the level of 1.2791 which is the closing of the last weekly candle, the price will move up with the goal of a pullback level of 50.0% - 1.2892 (blue dotted line) and after reaching the level down with the goal of 1.2690, a pullback level of 38.2% (red dotted line).
InstaForex analytical reviews will make you fully aware of market trends! Being an InstaForex client, you are provided with a large number of free services for efficient trading.

