 Permanecer
Condições de Negociações
Ferramentas


The pair resumed its downward movement yesterday. While moving down, the price broke through the support line - 1.1750 (white bold line) and tested the pullback level of 61.8% - 1.1715 (red dotted line). As per the economic calendar, euro news is expected at 08.55, 12.45, and 13.30 UTC, while dollar news is expected at 12.30 and 14.00 UTC. It is possible to recoil the work upwards.
Trend analysis (Fig. 1).
Today, the market may start moving up from the level of 1.1745 (closing of yesterday's daily candlestick) with the goal of 1.1807, which is a pullback level of 50.0% (blue dotted line). When testing this level, further work up with the goal of 1.1853, which is a pullback level of 61.8% (blue dotted line). Much will depend on the news (12:45 and 13:30 UTC).
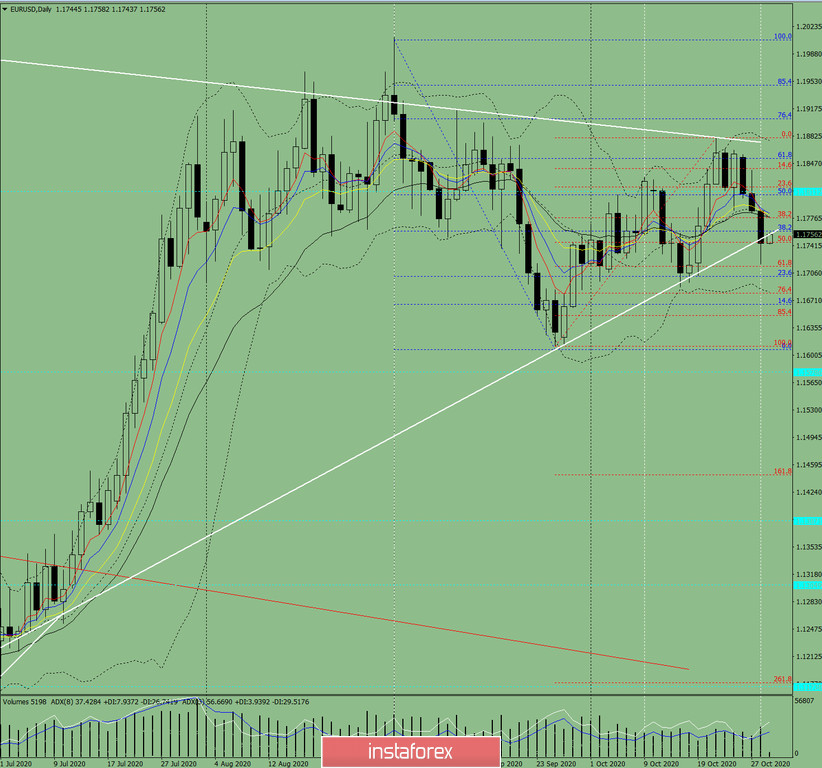
Figure 1 (Daily chart)
Comprehensive analysis:
General conclusion:
Today, the market from the level of 1.1745 (closing of yesterday's daily candlestick) may begin moving up with the goal of 1.1807, which is a pullback level of 50.0% (blue dotted line). When testing this level, further work up with the goal of 1.1853, which is a pullback level of 61.8% (blue dotted line).
Alternative scenario: from the level of 1.1745 (closing of yesterday's daily candle), the price may start moving up with the target of 1.1757, which is the resistance line (white bold line). When testing this line, further work downward with the goal of 1.1715, which is a pullback level of 61.8% (red dotted line).
InstaForex analytical reviews will make you fully aware of market trends! Being an InstaForex client, you are provided with a large number of free services for efficient trading.

