 Permanecer
Condições de Negociações
Ferramentas


Yesterday, the pair went up and tested the historical resistance level of 1.3393 (blue dotted line), then the market slightly rolled back closing the daily candle at 1.3381. Today, the price may continue to go up and the economic calendar news is not expected.
Trend analysis (Fig. 1).
Today, the market will continue to go up from the level of 1.3381 (closing of yesterday's daily candle) with the goal of 1.3436 at the target level of 161.8% (blue dotted line). After testing this line, it is possible to go down with a target of 1.3291, a pullback level of 14.6% (red dotted line).
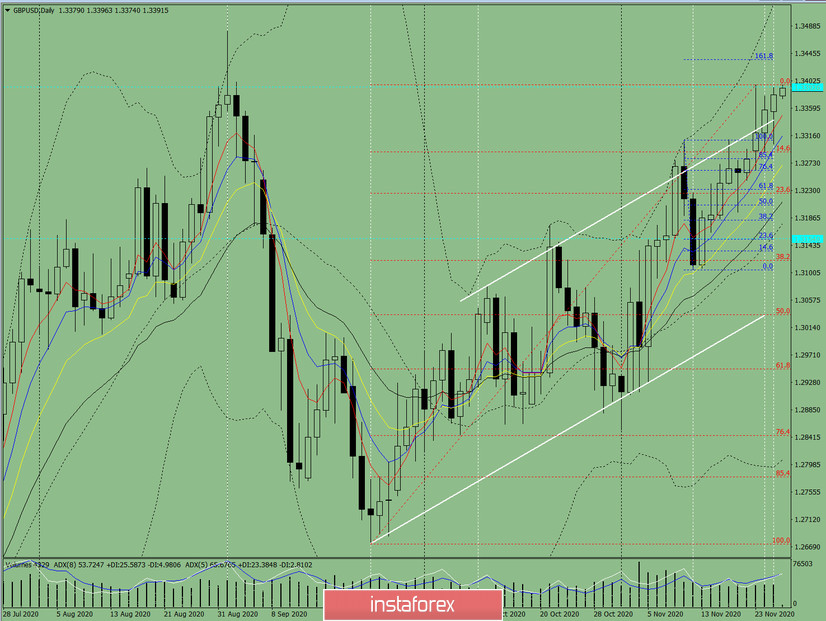
Figure 1 (daily chart).
Complex Analysis:
General Conclusion:
Today, the price) will continue to go up from the level of 1.3381 (closing of yesterday's daily candle) with the goal of 1.3436 at the target level of 161.8% (blue dotted line). After testing this line, it is possible to go down with a target of 1.3291, a pullback level of 14.6% (red dotted line).
Alternative scenario: if the market goes up and reaches the historical resistance level of 1.3393 (blue dotted line), it can go down with the target of 1.3290 – a pullback level of 14.6% (red dotted line).
InstaForex analytical reviews will make you fully aware of market trends! Being an InstaForex client, you are provided with a large number of free services for efficient trading.

