 Permanecer
Condições de Negociações
Ferramentas


Here are the details of the economic calendar for November 11, 2021:
Yesterday, a preliminary estimate of UK GDP for the third quarter was published, which reflected a slowdown in economic growth from 23.6% to 6.6%, which signals a difficult situation in the United Kingdom.
At the same time, the UK's industrial production data were published, where they recorded a slowdown from 3.7% to 2.9% against the forecast of 3.1%.
The market reacted negatively to statistics, so the pound sterling came under pressure from sellers.
At the same time, it was a holiday in the United States in celebration of Veterans Day. The banks, stock exchanges, funds are out of work. This affected the trading volumes, which made it possible for speculators to manipulate the market without any extra effort.
Analysis of trading charts from November 11:
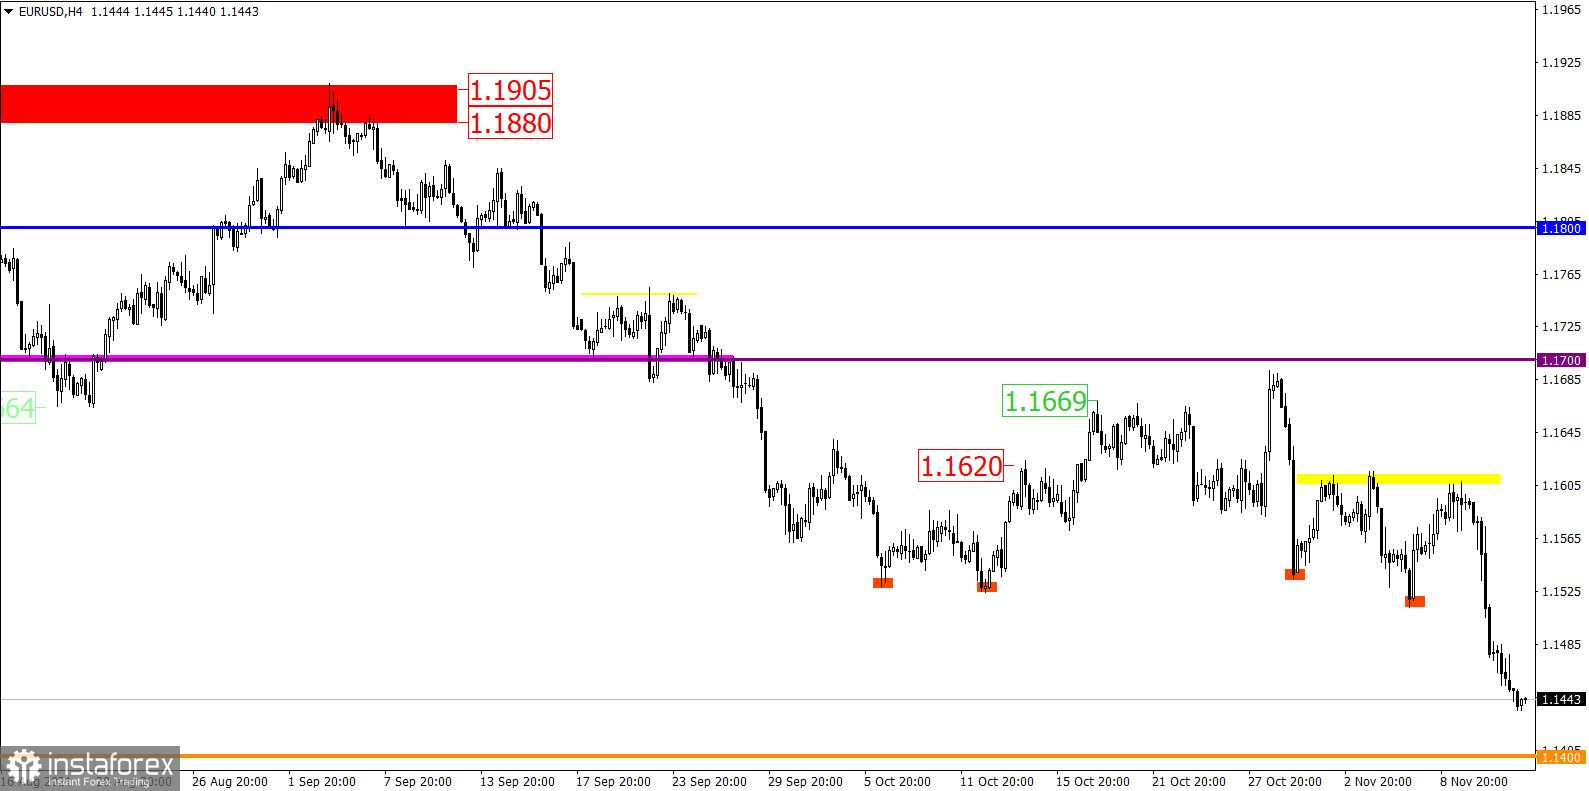
The European currency continued to update this year's local low, where the variable support in the face of the value of 1.1460 was broken by greedy speculators. The signal of a change of trading interests was confirmed again, where the downward cycle from the beginning of June is considered the main one in the market.
The trading plan on November 11 considered sell positions if the price was kept below the level of 1.1460.
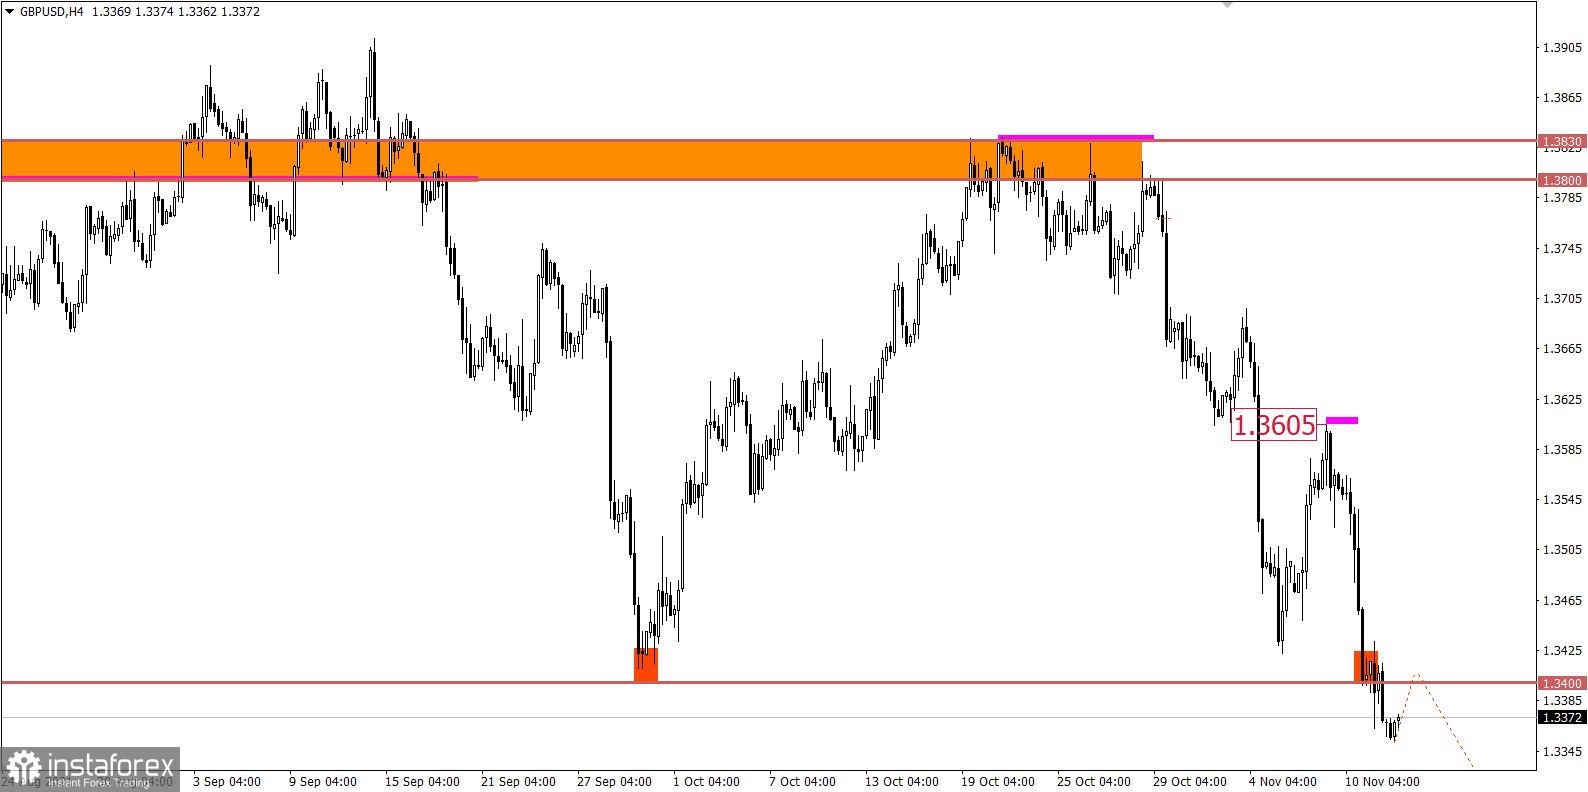
The British currency continued to decline after a slight stop, breaking through the support level of 1.3400 on the way. This step led to the prolongation of the descending cycle from the beginning of June.
The daily chart shows a change in the medium-term trend, which may lead to very large price changes in the future.
The trading plan on November 11 considered a subsequent decline if the price was kept below the support level of 1.3400.

November 12 economic calendar:
Europe's industrial production data will be published today at 10:00 Universal time, where their volume may fall from 5.1% to 4.1%. This is a negative factor that will put pressure on the European currency.
After that, US JOLTS data on open vacancies will be published at 15:00 Universal time, the total number of which should decline from 10,439 thousand to 4,300 thousand. It is unlikely that anyone will pay attention to them.
Trading plan for EUR/USD on November 12:
It can be assumed that the euro will continue to weaken towards the level of 1.1400 despite the US dollar's positions overheating. A gradual decline leads to a change in the medium-term trend.
Trading plan for GBP/USD on November 12:
Market participants do not pay attention to the oversold signal. Stable price retention below the 1.3400 level increases the sellers' chance of a subsequent decline. During the new trading week, the levels of 1.3250-1.3000 are considered pivot points.
What is reflected in the trading charts?
A candlestick chart view is graphical rectangles of white and black light, with sticks on top and bottom. When analyzing each candle in detail, you will see its characteristics of a relative period: the opening price, closing price, and maximum and minimum prices.
Horizontal levels are price coordinates, relative to which a stop or a price reversal may occur. These levels are called support and resistance in the market.
Circles and rectangles are highlighted examples where the price of the story unfolded. This color selection indicates horizontal lines that may put pressure on the quote in the future.
The up/down arrows are the reference points of the possible price direction in the future.
InstaForex analytical reviews will make you fully aware of market trends! Being an InstaForex client, you are provided with a large number of free services for efficient trading.


