 Permanecer
Condições de Negociações
Ferramentas


Buying Baidu's stock is hedged by selling Comcast.
Buying Baidu's stock(#BIDU). Chinese Internet service, search engine.
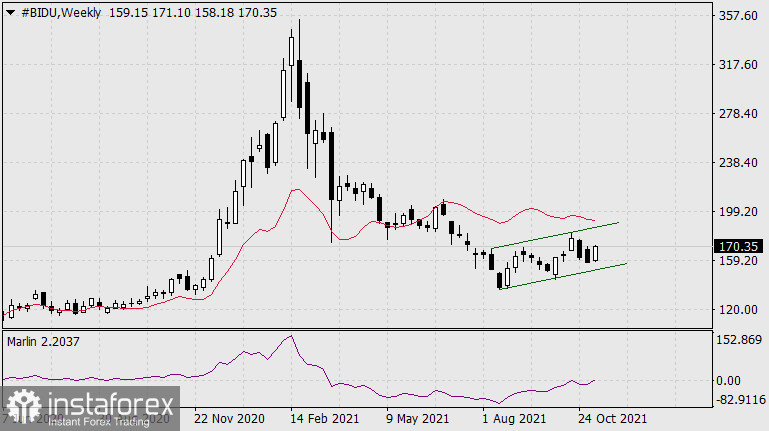
On the weekly chart, the signal line of the Marlin oscillator has overcome the boundary of the bulls' territory. The price is developing in the local rising price channel. Price growth to its upper boundary is likely with the probable exit from it. Let's discuss the details on a daily chart.
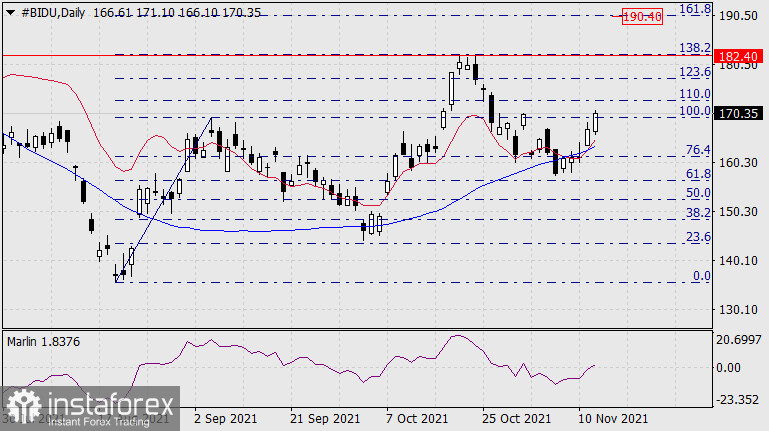
On the daily chart, the price has consolidated above the balance and Kruzenshtern indicator lines, the Marlin oscillator has entered the zone of positive values, i.e. the price moves into the area of predominant growth. The first movement target is the 138.2% Fibonacci level at 182.40. Besides, it is also a resistance level on October 20-22 and support on June 16-21. The second target is the 161.8% Fibonacci level at 190.40.
Selling Comcast Corporation's stock(#CMCSA). US telecommunications corporation.
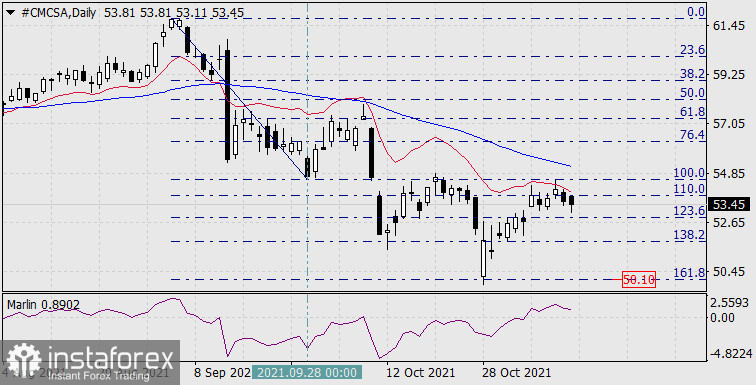
On the daily chart, it is possible to observe that on the third bar the price reversed from the 100.0% Fibonacci level, the low of September 28 and resistance of October 20-21. At the same time, the price did not cross over the red indicator balance line. This fact indicates that the price growth occurred within the correction. The trend is descending and now the price is reversing to the direction of its new wave. The Marlin oscillator is turning downward. The nearest movement target is the 161.8% Fibonacci level at the price of 50.10.
InstaForex analytical reviews will make you fully aware of market trends! Being an InstaForex client, you are provided with a large number of free services for efficient trading.


