 Permanecer
Condições de Negociações
Ferramentas


Trend analysis (fig. 1).
On Friday, the pair may decrease from the level of 1.3595 (the closing of yesterday's daily candlestick) to the target level of 1.3558, which is the support level (yellow bold line). After testing this level, the price may start moving up to the target level of 1.3618, the historical resistance level (blue dotted line).
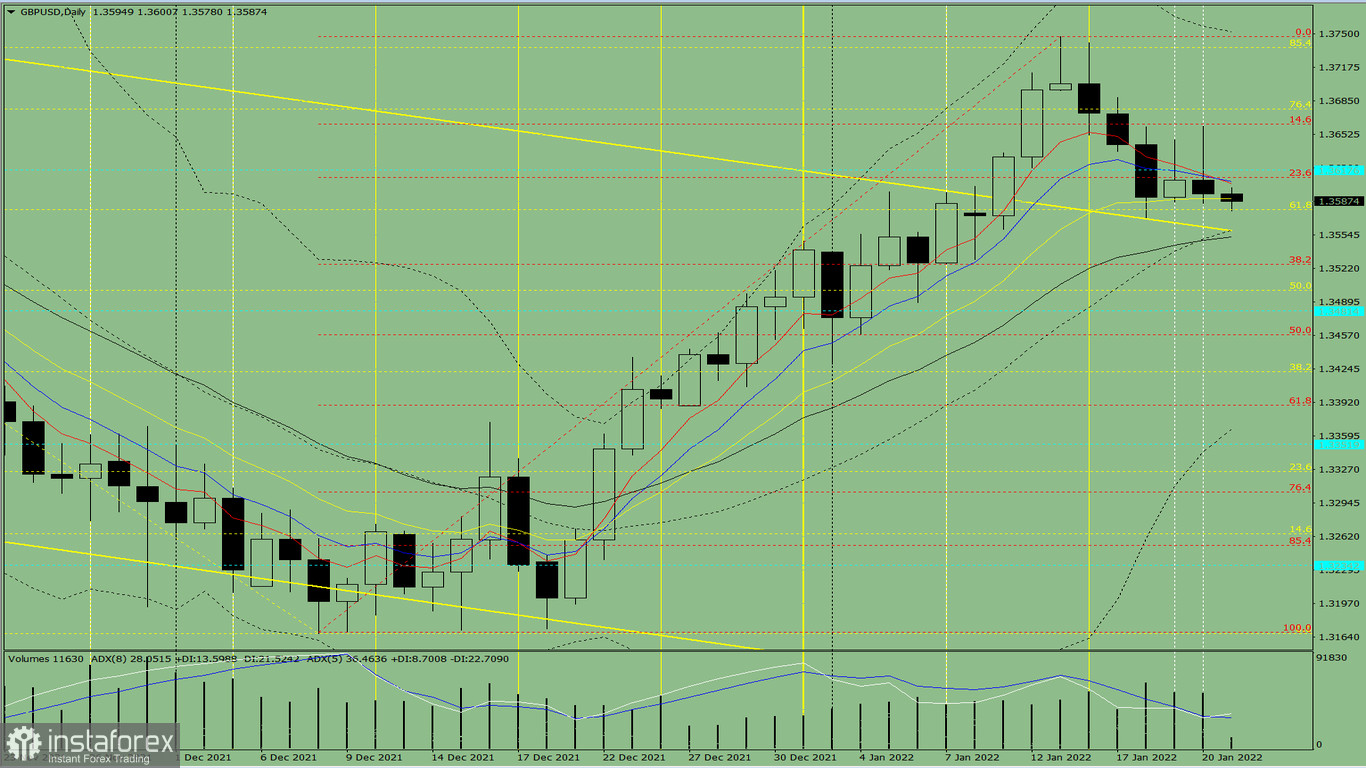
Fig. 1 (daily chart).
Complex analysis:
- indicator analysis - down;
- Fibonacci retracement levels – down;
- trading volumes – down;
- candlestick analysis– down;
- trend analysis – up;
-Bollinger bands - up;
- weekly chart - down.
Conclusion:
On Friday, the pair may decrease from the level of 1.3595 (the closing of yesterday's daily candlestick) to the target level of 1.3558, which is the support level (yellow bold line). After testing this level, the price may start moving up to the target level of 1.3618, the historical resistance level (blue dotted line).
Alternatively, the pair may fall from the level of 1.3595 (the closing of yesterday's daily candlestick) to the target level of 1.3526, the Fibonacci retracement level of 38.2% (red dotted line). After testing this level, it may start moving up to the target level of 1.3618, the historical resistance level (blue dotted line).
InstaForex analytical reviews will make you fully aware of market trends! Being an InstaForex client, you are provided with a large number of free services for efficient trading.


