 Permanecer
Condições de Negociações
Ferramentas


Trend analysis (Fig. 1).
The euro-dollar pair may move up from the level of 1.0678 (close of yesterday's daily candle) to test the upper fractal at 1.0748 (yellow dotted line). Upon reaching this level, the price may continue to move up to the resistance level 1.0821 (thick white line). From here, a downward pullback is possible with the target at the historical support level 1.0760 (blue dotted line).
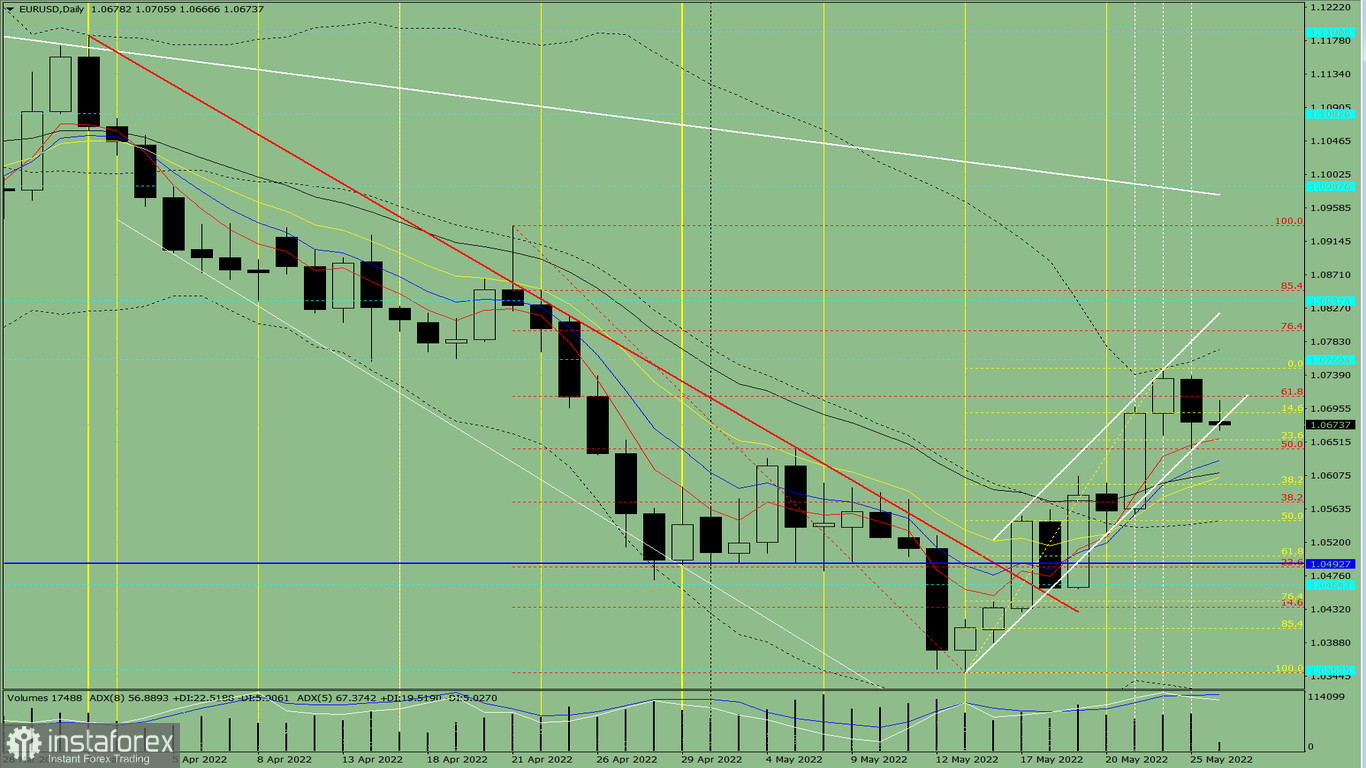
Fig. 1 (daily chart).
Comprehensive analysis:
Today the price may move up from the level of 1.0678 (close of yesterday's daily candle) to test the upper fractal at 1.0748 (yellow dotted line). Upon reaching this level, the price may continue to move up to the resistance level 1.0821 (thick white line). From here, a downward pullback is possible with the target at the historical support level 1.0760 (blue dotted line).
Alternative scenario: from the level of 1.0678 (close of yesterday's daily candle), the price may move downward to test 1.0612, the 21-period EMA (black thin line). Upon reaching this level, the price may move upward to 1.0711, the 61.8% retracement level (red dotted line). From this level, the price may continue to move up.InstaForex analytical reviews will make you fully aware of market trends! Being an InstaForex client, you are provided with a large number of free services for efficient trading.

