 Permanecer
Condições de Negociações
Ferramentas


Inflation in the Eurozone has logged the first downtick from a previous month since June 2021.The Eurostat reported that the annual CPI rate eased to 10% in November from 10.6%. The ECB is sure to underscore this fact at the coming policy meeting but the regulator is likely to decide on another jumbo rate hike.
The focal point yesterday was a speech by Jerome Powell. The Federal Reserve's Chairman dropped a hint about the moderation in the pace of rate hikes in December. This information signal was a catalyst for the rally in the US stock market and a sell-off of dollar-denominated assets.
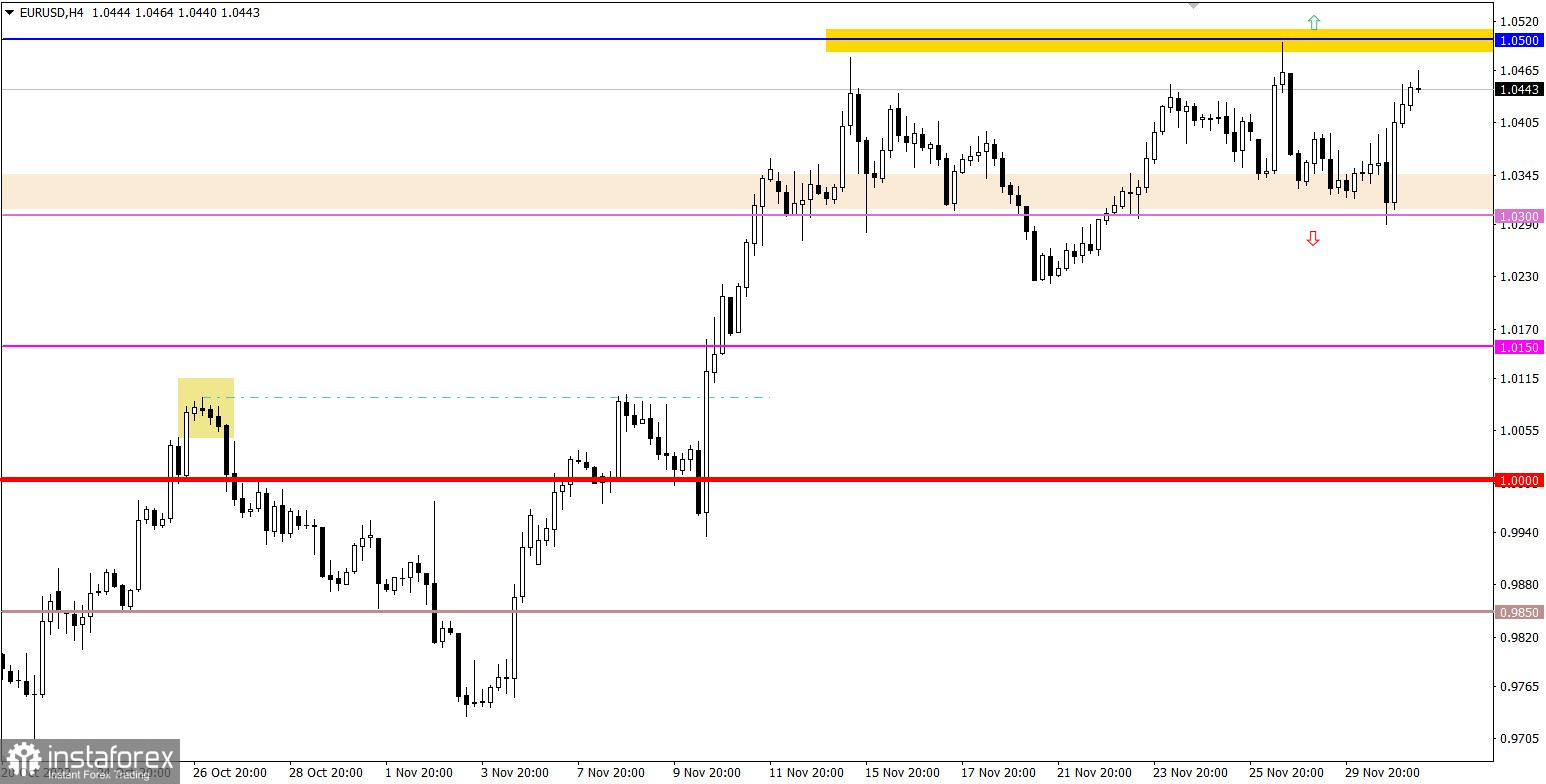
EUR/USD rebounded from the support level of 1.0300. As a result, the price developed an inertial rally, heading for resistance at 1.0500.
The cause and effect of the bounce is the information background. Technical analysis coincided with it.
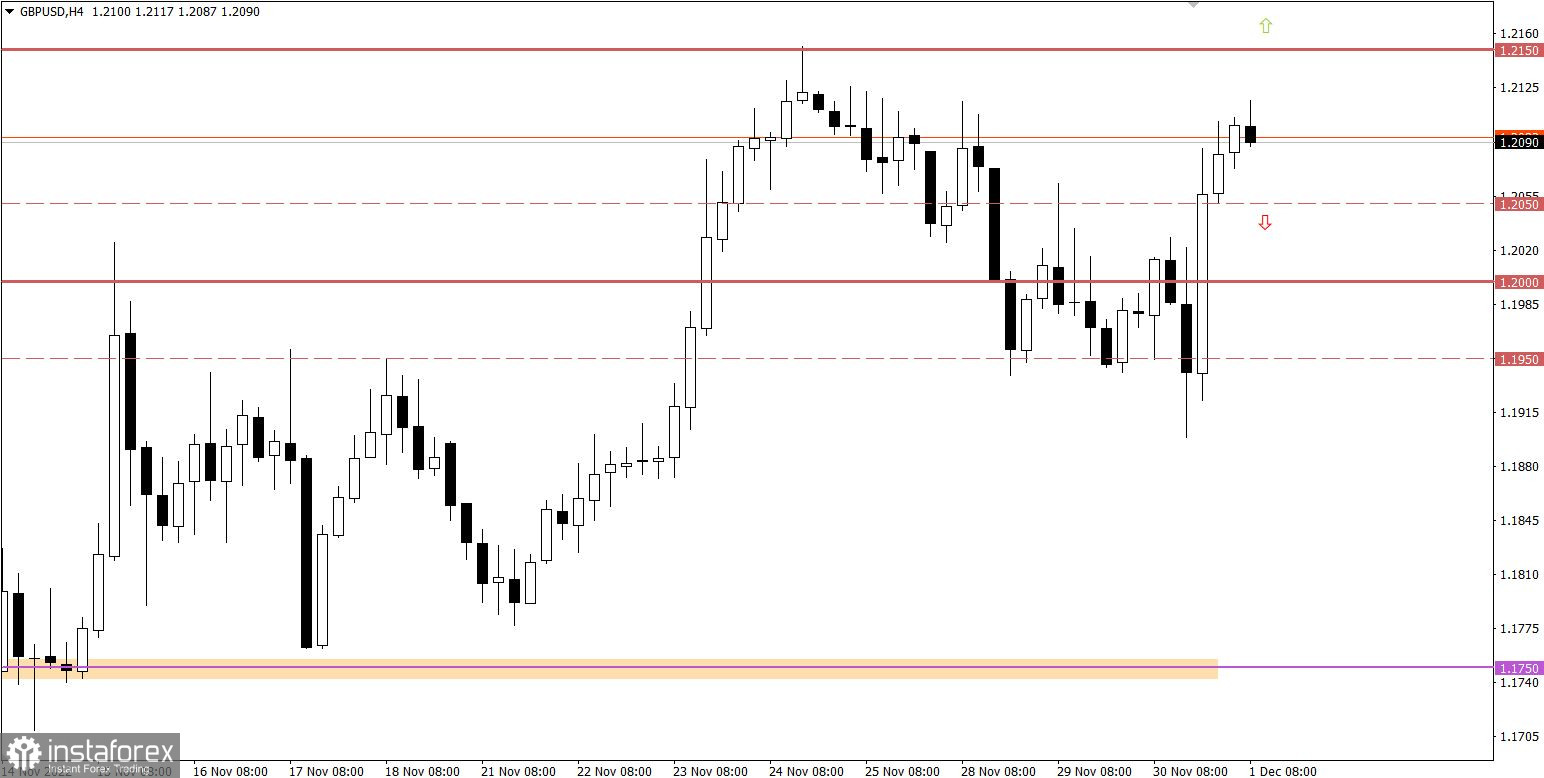
After sideways trading at about the psychological level of 1.1950/1.2000, GBP/USD has not been able to settle in this area. In consequence, this area was worked out by traders as support where the price gained impetus for the bounce.

Today, market participants will take notice of the EU unemployment rate which is expected to grow to 6.9% from 6.6%. A rise in the jobless rate could shake the euro's confidence.
During the New York trade, traders will monitor a weekly update on US unemployment claims as usual on Thursdays. The consensus suggests an increase in the number of jobless claims. This is a bad omen for the US labor market.
The number of continued unemployment claims could have increased from 1.551 mln to 1.573 mln.
The number of first-time unemployment claims is expected to decline slightly from 240K to 235K.
Schedule
EU unemployment rate – 10:00 GMT
US unemployment claims – 13:30 GMT
Under such market conditions, the key support and resistance levels of 1.0300 and 1.0500 are still valid for traders. I reckon if the price settles beyond any of the key levels on the 4-hour chart, it will indicate a further trajectory and a cycle of EUR/USD. Until then, the reasonable strategy is to open appropriate positions at price bounces and drops.
The buyers are still facing resistance at 1.2150. Last week, the price dropped from this level. Supposedly, speculators aim to break through this level. In this case, the ongoing upward cycle from the lows of the downtrend will be extended for GBP/USD. Importantly, a breakout of 1.2150 will be a genuine one only in case the price settles above this level on the daily chart.
Until the breakout of 1.2150 is not confirmed, traders will follow the alternative scenario of a price drop.
The candlestick chart type is white and black graphic rectangles with lines above and below. With a detailed analysis of each individual candle, you can see its characteristics relative to a particular time frame: opening price, closing price, intraday high and low.
Horizontal levels are price coordinates, relative to which a price may stop or reverse its trajectory. In the market, these levels are called support and resistance.
Circles and rectangles are highlighted examples where the price reversed on history. This color highlighting indicates horizontal lines that may put pressure on the asset's price in the future.
The up/down arrows are landmarks of the possible price direction in the future.
InstaForex analytical reviews will make you fully aware of market trends! Being an InstaForex client, you are provided with a large number of free services for efficient trading.


