 Permanecer
Condições de Negociações
Ferramentas


The highlight of the last week was certainly the report by the US Labor Department. Oddly, its content aroused more questions than joy.
Basic details:
At first glance, the US labor market remains healthy judging by the statistics. However, we should bear in mind the words of the Fed's Chairman, saying that inflation will not be stemmed without a slowdown in business activity. Therefore, we see that growing wages and employment are the driving forces for high inflation.
All in all, there are preconditions for persistent inflationary pressure in the economy.
During its robust upward move, EUR/USD surpassed the resistance level of 1.0500. In consequence, the instrument gave a technical signal about the extension of the ongoing upward cycle from the lows of the downtrend.
After a brief halt at about 1.2300, GBP/USD continues its climb. As a result, the resistance level was broken and the price settles firmly about it.

Commonly, the economic calendar is empty on Monday but this time is different. Today market participants will get to know revised PMIs for the Eurozone and the US which are likely to match flash estimates. In this case, we should not expect a strong response from the market as everything has been already priced in. However, if the actual scores defy the preliminary readings, traders will have an excuse for speculation.
Traders will shift focus to the EU retail sales which are expected to accelerate their decline to -2.2% from -0.6%. Such negative information from the EU could discourage the euro bulls which might entail a downward correction.
Schedule
EU PMIs are due at 13:30 GMT
UK PMIs – at 09:30 GMT
EU retail sales – 09:30 GMT
US PMIs – 14:45 GMT
Under such market conditions, traders are poised to revise market sentiment on GBP/USD for the medium term. Under this scenario, the downtrend could take a back seat for a while. Therefore, the euro is expected to develop an uptrend bit by bit.
As for the short-term outlook, rapid growth in EUR propelled the shared currency to overbought levels. It suggests a downward correction. The buyers could face resistance at 1.0610 at the moment.

Despite growing overbought levels of GBP/USD, the price is still following an inertial move when technical signals may be neglected by traders. Thus, the price consolidation above 1.2300 enables the scenario of increasing long positions. So, the currency pair might extend its growth.
As for the downward scenario, the price should first retreat to levels below 1.2300 on the daily chart. This scenario will be realistic in such conditions.
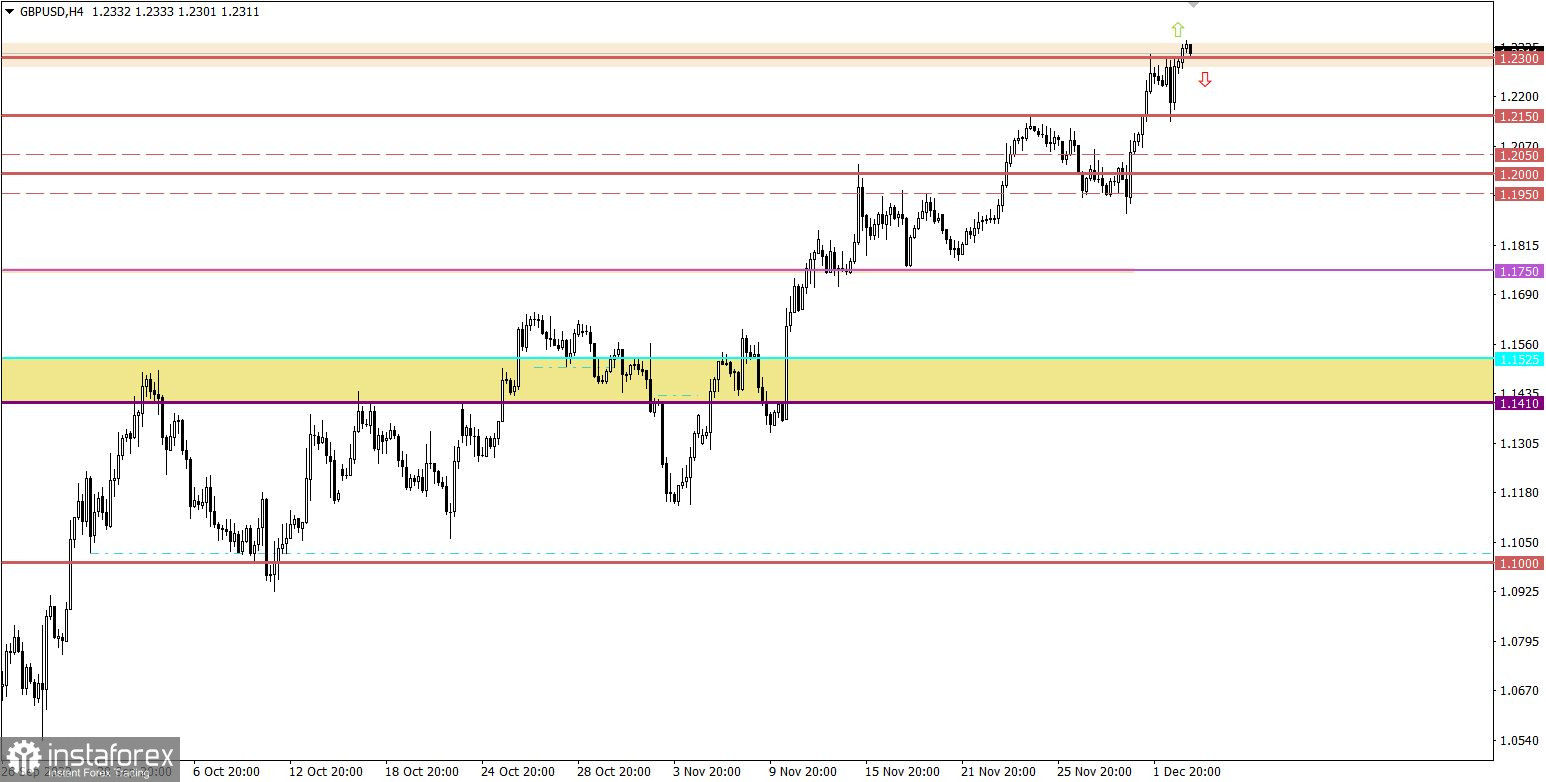
The candlestick chart shows graphical white and black rectangles with upward and downward lines. While conducting a detailed analysis of each individual candlestick, it is possible to notice its features intrinsic to a particular time frame: the opening price, the closing price, the highest and lowest price.
Horizontal levels are price levels, in relation to which the price may stop or reverse its direction. They are called support and resistance levels.
Circles and rectangles are highlighted examples where the price reversed in the course of its history. This color highlighting indicates horizontal lines which can exert pressure on prices in the future;
Upward/downward arrows signal possible future price direction.
InstaForex analytical reviews will make you fully aware of market trends! Being an InstaForex client, you are provided with a large number of free services for efficient trading.


