 Permanecer
Condições de Negociações
Ferramentas


Trend-following analysis
In January, EUR/USD is expected to move higher from 1.0706, the level of closing the December one-month high, to the target at 1.0941, which is the 50.0% Fibonacci retracement level plotted by the red dotted line. Once this level is tested, the instrument will continue its rise to 1.1104, the historic resistance level plotted by the blue dotted line. After this level is tested, we could expect a downward retracement.
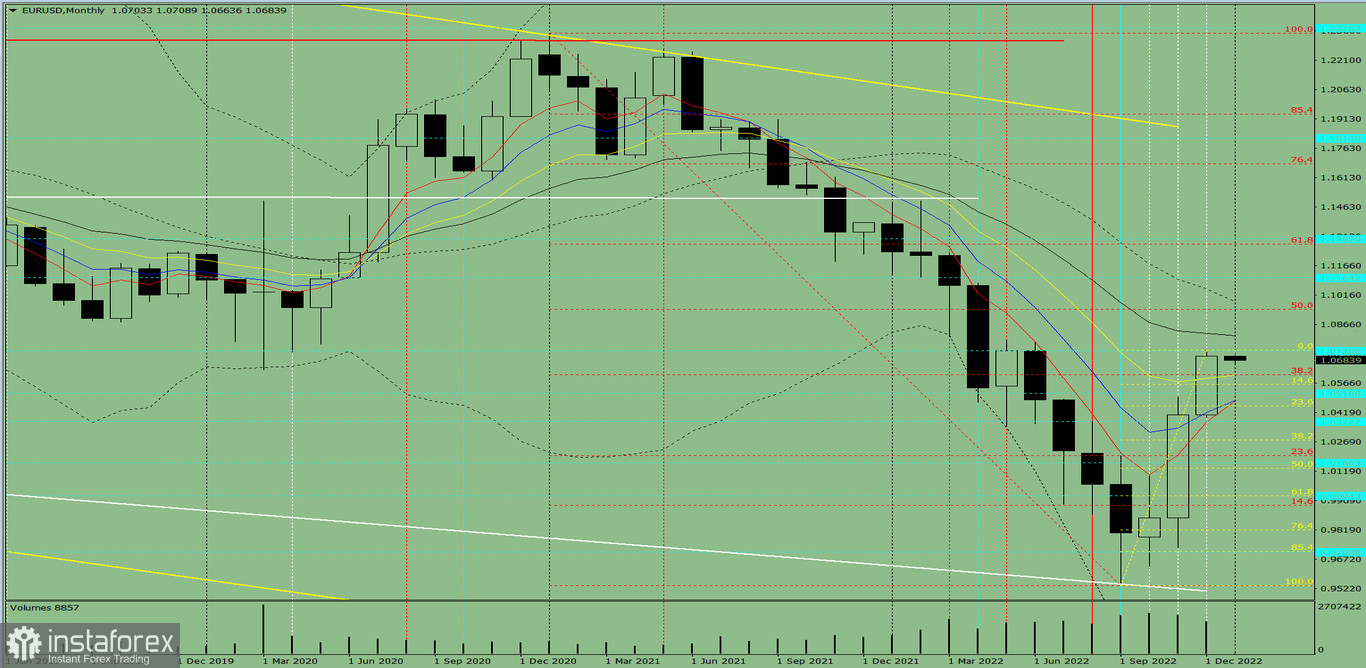
Picture 1, one-month chart
Indicator analysis
The conclusion from the complex analysis is that EUR/USD is likely to trade higher.
The one-month chart of EUR/USD draws traders to the conclusion that the overall trend is going to be bullish. The one-month white candlestick lacks the first lower shadow in the first week. The second upper shadow is also missing on the final week.
The basic scenario. EUR/USD is expected to move higher from 1.0706, the level of closing the December one-month candlestick, to the target at 1.0941, which is the 50.0% Fibonacci retracement level plotted by the red dotted line. Once this level is tested, the instrument will continue its rise to 1.1104, the historic resistance level plotted by the blue dotted line. After this level is tested, we could expect a downward retracement.
Alternative scenario. EUR/USD might also move higher from 1.0706, the level of closing the December one-month candlestick, towards the target of 1.0941, which is the 50.0% Fibonacci retracement level plotted by the red dotted line. After this level is tested, the price will retrace downwards. 1.0809 serves as a 21-period moving average plotted by the black thin line.
InstaForex analytical reviews will make you fully aware of market trends! Being an InstaForex client, you are provided with a large number of free services for efficient trading.


