 Permanecer
Condições de Negociações
Ferramentas


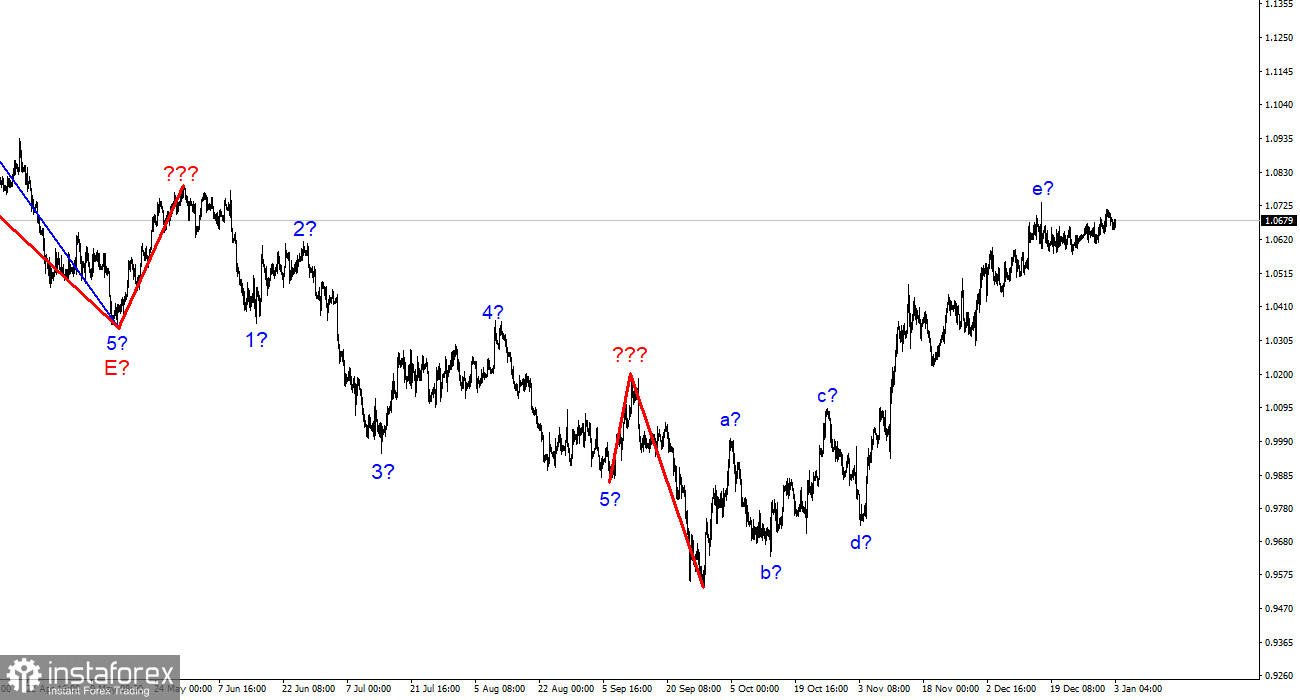
The EUR/USD wave layout on the 4-hour chart looks rather clear. The entire ascending section of the trend has a complex structure. It has taken a clearly corrective and extended form. So, we have a complex corrective wave pattern consisting of a-b-c-d-e parts where wave e has a more complex structure than the previous four waves. If the current wave setup is correct, then this structure may be nearing its completion or has already been completed as the peak of the wave e is much higher than the peak of the wave c. If so, we can expect the formation of at least three descending waves. I anticipate a strong decline in the pair although it may start a bit later due to slow market activity after the winter holidays. A failed attempt to break through the 1.0726 level, which corresponds to the 200.0% Fibonacci level, indicates that the market is ready to turn bearish on the pair. However, demand for the US dollar hasn't increased yet despite all the favorable factors. The internal structure of the wave e looks very unclear as we can hardly identify any sub-waves within it.
Markets slowly back to work
On Monday, the euro/dollar pair dropped by 40 pips. In the last few days of 2022, the demand for the instrument increased slightly. Yet, the pair still failed to break through the 200.0% Fibonacci level. The high of wave e has not been broken yet. Therefore, we can say that this wave is complete. We have an excellent signal and a strong level of 1.0726 from where we can make trading decisions. A successful breakout of this level will indicate that the market is ready to buy the euro. This means that the entire ascending section of the trend will become even more extended. In a different scenario, the pair will decline and form at least a three-wave structure.
Today, Europe will publish the first important economic report at the start of the year. Usually, I don't take into consideration the data from Germany, Spain, or Italy as these are just the countries inside the eurozone. Therefore, the reaction of the market to the data from separate countries is usually weak or zero. However today, the pair is trading flat which means that market participants may appreciate such a report. In December, inflation in Germany is expected to have eased to 9.1% from 10%. If the forecast meets market expectations, it will indicate a considerable slowdown in consumer prices. I would like to remind you that Germany is a powerhouse of the EU which is why its inflation may decline faster than in other EU countries. At the same time, inflation in the eurozone (which is more crucial for the euro) may remain high due to slower progress in other block members. Therefore, the inflation rate in Germany cannot be used to evaluate the inflation in the eurozone.
Conclusion
Based on the analysis above, I can conclude that the ascending section of the trend has become more complex and took on a five-wave structure that is nearing its completion. With this in mind, I would recommend selling the pair with the targets located at 0.9994, which corresponds to the 323.6% Fibonacci level. It is also possible that the ascending section of the trend will get a more extended form. This scenario is very likely. At least, we have a relevant sell signal.
On higher time frames, the wave layout of the descending section of the trend is getting extended and more complex. We have identified five ascending waves that most likely make up the a-b-c-d-e pattern. The pair may start a downtrend as soon as this trend section is completed.
InstaForex analytical reviews will make you fully aware of market trends! Being an InstaForex client, you are provided with a large number of free services for efficient trading.


