 Permanecer
Condições de Negociações
Ferramentas


Trend analysis (Fig. 1).
The EUR/USD currency pair may move downward from the level of 1.0881 (closing of Friday's daily candle) to 1.0861, the 50.0% pullback level (blue dotted line). From this level, an upward movement is possible with a target at the 1.0924 resistance level (white thick line). In the case of testing this level, the price may continue to rise with a target of 1.0944, the 14.6% pullback level (yellow dotted line), where a downward movement is possible.
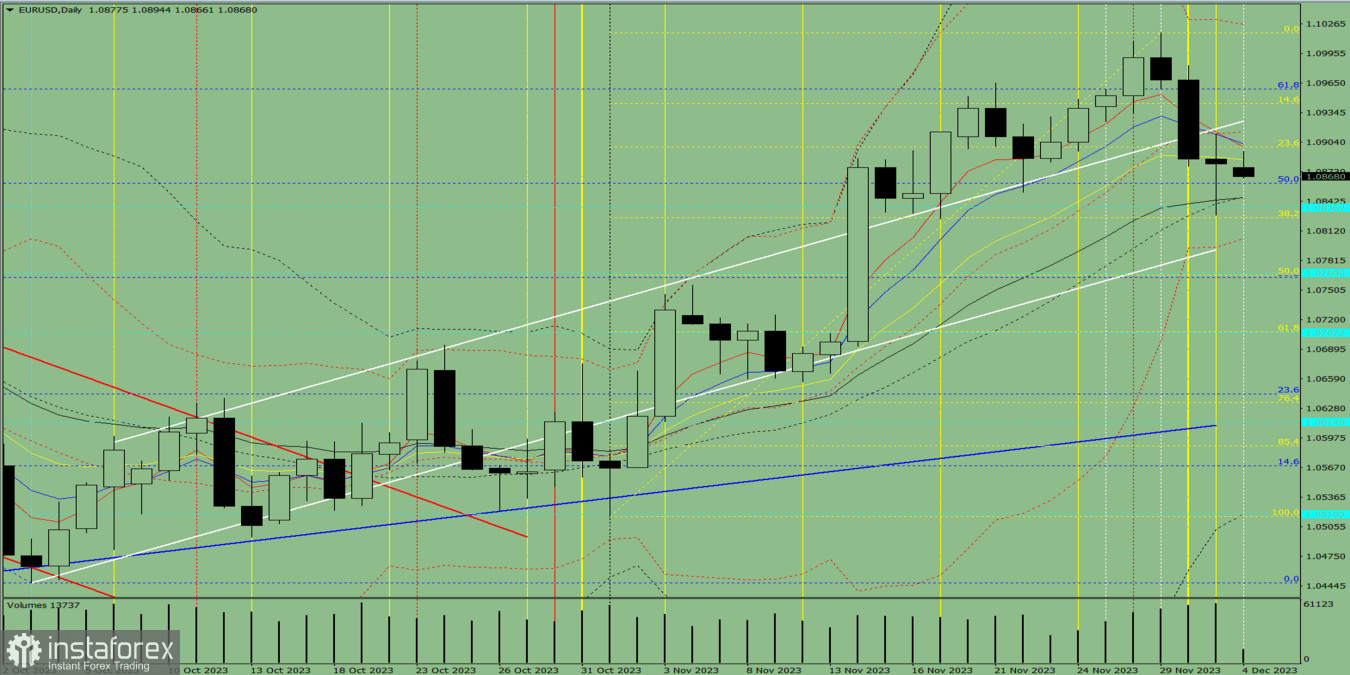
Fig. 1 (daily chart).
Comprehensive analysis:
Today, the price may move downward from the level of 1.0881 (closing of Friday's daily candle) to 1.0861, the 50.0% pullback level (blue dotted line). From this level, an upward movement is possible with a target at the 1.0924 resistance level (white thick line). In the case of testing this level, the price may continue to rise with a target of 1.0944, the 14.6% pullback level (yellow dotted line), where a downward movement is possible.
Alternatively, the price may move downward from the level of 1.0881 (closing of Friday's daily candle) to 1.0846, the 21-day EMA (black thin line). From this level, an upward movement is possible with a target at the 1.0924 resistance level (white thick line).
InstaForex analytical reviews will make you fully aware of market trends! Being an InstaForex client, you are provided with a large number of free services for efficient trading.


