 Permanecer
Condições de Negociações
Ferramentas


EUR/USD showed ultra-low volatility on Friday. The range from the day's low to the high was only 26 pips. Therefore, we did not expect any trading signals or profits for the rest of the day. On Thursday, the pair went through around 70 pips of volatility, and traders immediately received good trading signals and were able to make profit. Therefore, we would like to remind you that if the pair is standing still, then you shouldn't expect any good profit.
Two moderately important reports were published in the United States: the University of Michigan Consumer Sentiment Index and Industrial Production. The first one turned out to be slightly below forecasts, while the second one was slightly above estimates. In general, there was a balance, but the market could have been more active. However, this week we clearly realized one thing: US inflation is more likely to rise than fall. Therefore, we expect the dollar to strengthen further.
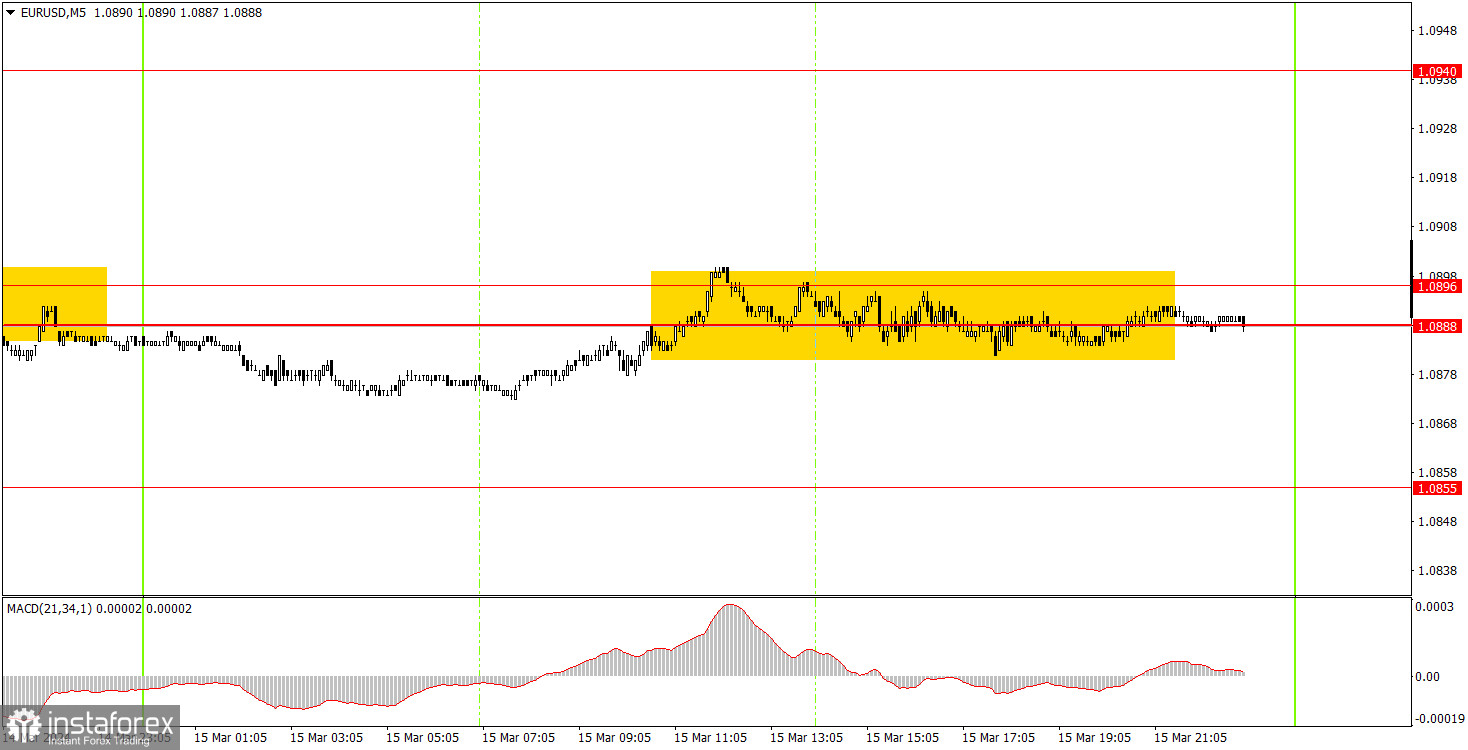
No trading signals were formed on the 5-minute timeframe. During the European session, the price smoothly approached the range of 1.0888-1.0896, and it stayed within this range until the market closed. Therefore, novice traders had no reason to enter the market.
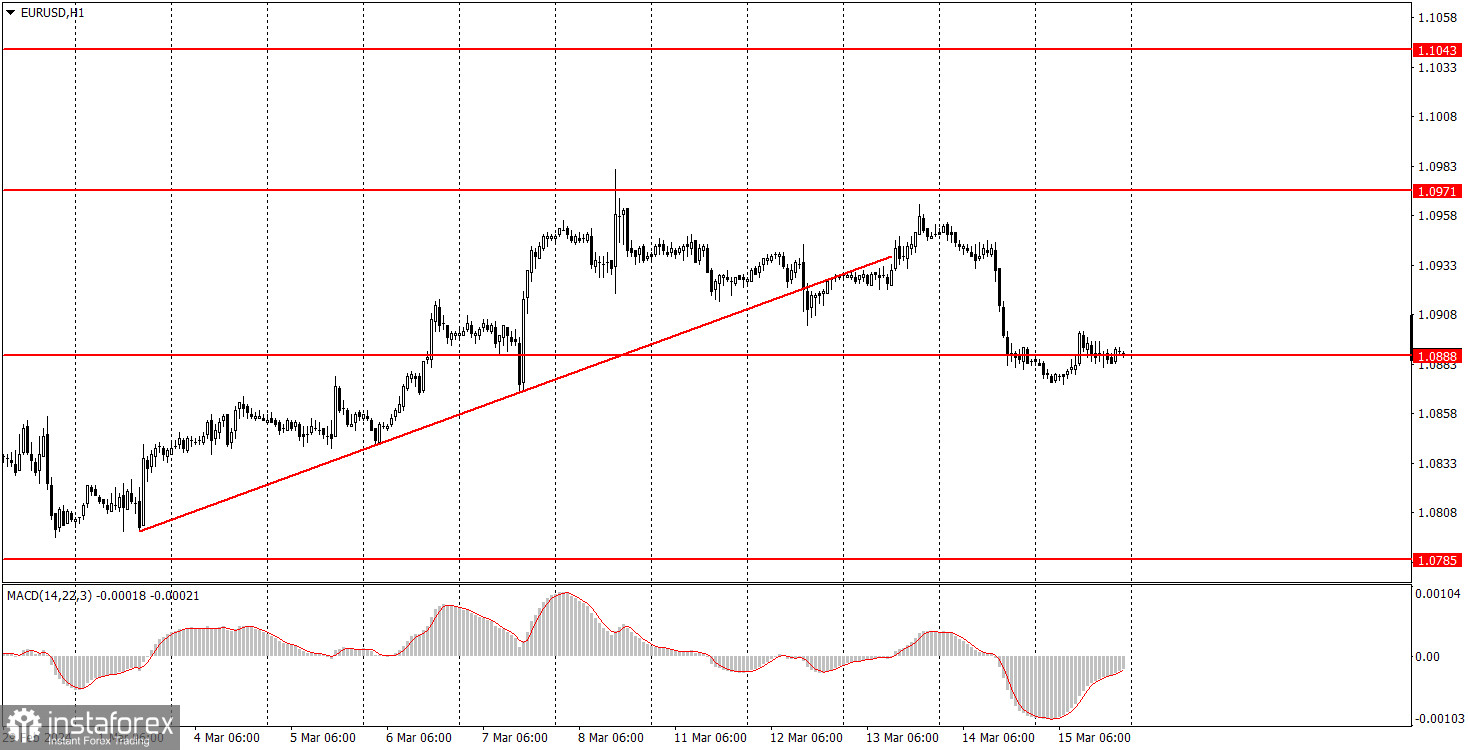
On the hourly chart, EUR/USD has started to move downwards, and we can only hope that this time the dollar will rise. We still expect a pronounced decline from the euro, which, in our opinion, should continue for quite some time. We assume that the bullish correction, which lasted for over a month, has finally ended. If that's the case, then a new downward trend will form. Remember that the euro still lacks significant factors that can support its growth.
The key levels on the 5M chart are 1.0568, 1.0611-1.0618, 1.0668, 1.0725, 1.0785-1.0797, 1.0855, 1.0888-1.0896, 1.0940, 1.0971-1.0981, 1.1011, 1.1043, 1.1091. On Monday, we can only highlight the Eurozone inflation data. However, this will be the second estimate for February, and we don't expect any significant differences from the initial estimate. Therefore, the market will have little reason to react to this report. It will likely be another "boring Monday."
1) Signal strength is determined by the time taken for its formation (either a bounce or level breach). A shorter formation time indicates a stronger signal.
2) If two or more trades around a certain level are initiated based on false signals, subsequent signals from that level should be disregarded.
3) In a flat market, any currency pair can produce multiple false signals or none at all. In any case, the flat trend is not the best condition for trading.
4) Trading activities are confined between the onset of the European session and mid-way through the U.S. session, after which all open trades should be manually closed.
5) On the 30-minute timeframe, trades based on MACD signals are only advisable amidst substantial volatility and an established trend, confirmed either by a trendline or trend channel.
6) If two levels lie closely together (ranging from 5 to 15 pips apart), they should be considered as a support or resistance zone.
Support and Resistance price levels can serve as targets when buying or selling. You can place Take Profit levels near them.
Red lines represent channels or trend lines, depicting the current market trend and indicating the preferable trading direction.
The MACD(14,22,3) indicator, encompassing both the histogram and signal line, acts as an auxiliary tool and can also be used as a signal source.
Significant speeches and reports (always noted in the news calendar) can profoundly influence the price dynamics. Hence, trading during their release calls for heightened caution. It may be reasonable to exit the market to prevent abrupt price reversals against the prevailing trend.
Beginning traders should always remember that not every trade will yield profit. Establishing a clear strategy coupled with sound money management is the cornerstone of sustained trading success.
InstaForex analytical reviews will make you fully aware of market trends! Being an InstaForex client, you are provided with a large number of free services for efficient trading.


