 Permanecer
Condições de Negociações
Ferramentas


On Friday, the GBP/USD currency pair also traded lower, with most of the decline occurring during the U.S. trading session. As mentioned earlier, the Nonfarm Payrolls (NFP) and Unemployment Rate reports were broadly positive for the U.S. dollar, though not entirely clear-cut.
Additionally, the University of Michigan Consumer Sentiment Index added a bearish factor for the dollar. The index fell from 71.1 to 67.8 in February, acting as a negative counterbalance to the stronger labor market data.
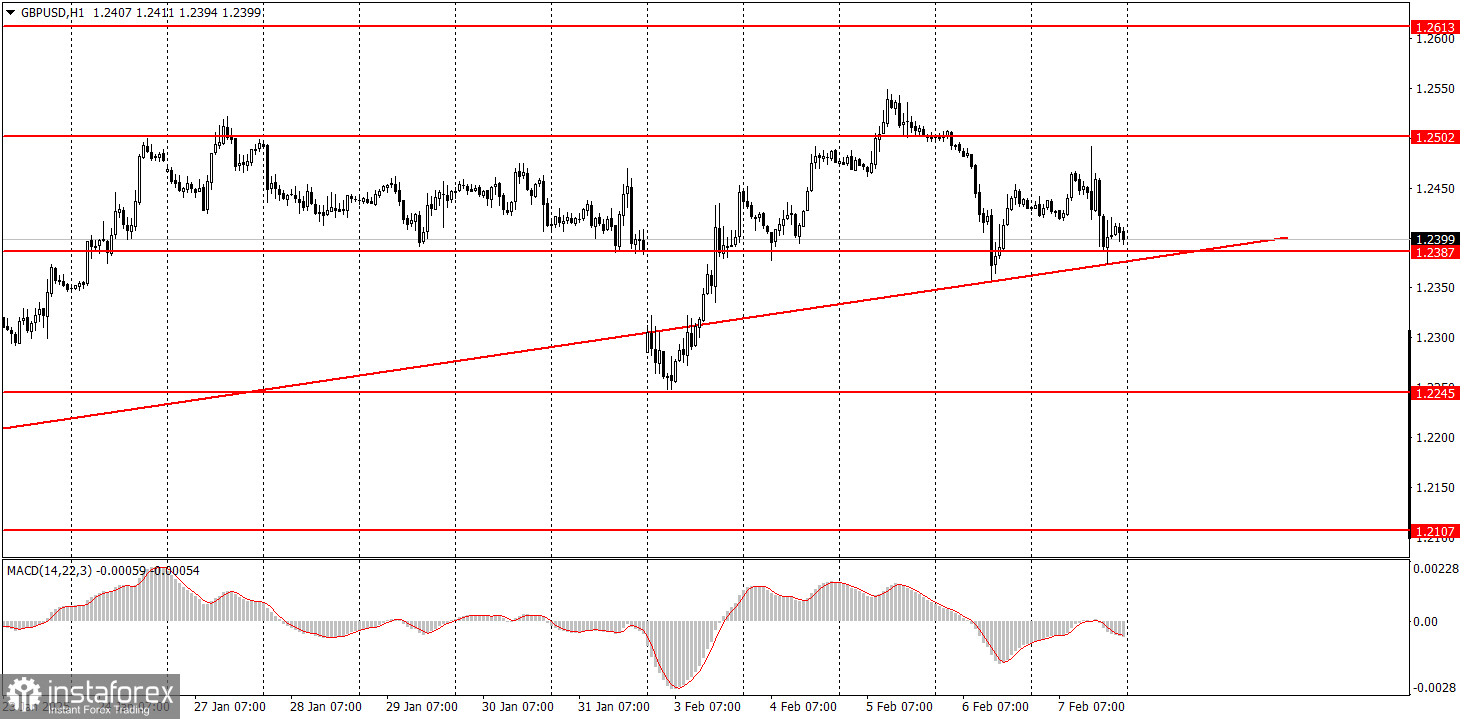
As a result, the dollar appreciated against the pound, but the movement was moderate, reflecting the mixed nature of the macroeconomic data. The GBP/USD pair remains above its upward trendline, meaning that the false breakout from Monday should be ignored. In the coming weeks, the pound could still lean towards an upward move, although there are very few fundamental reasons supporting it. The upward correction on the daily timeframe is still weak.
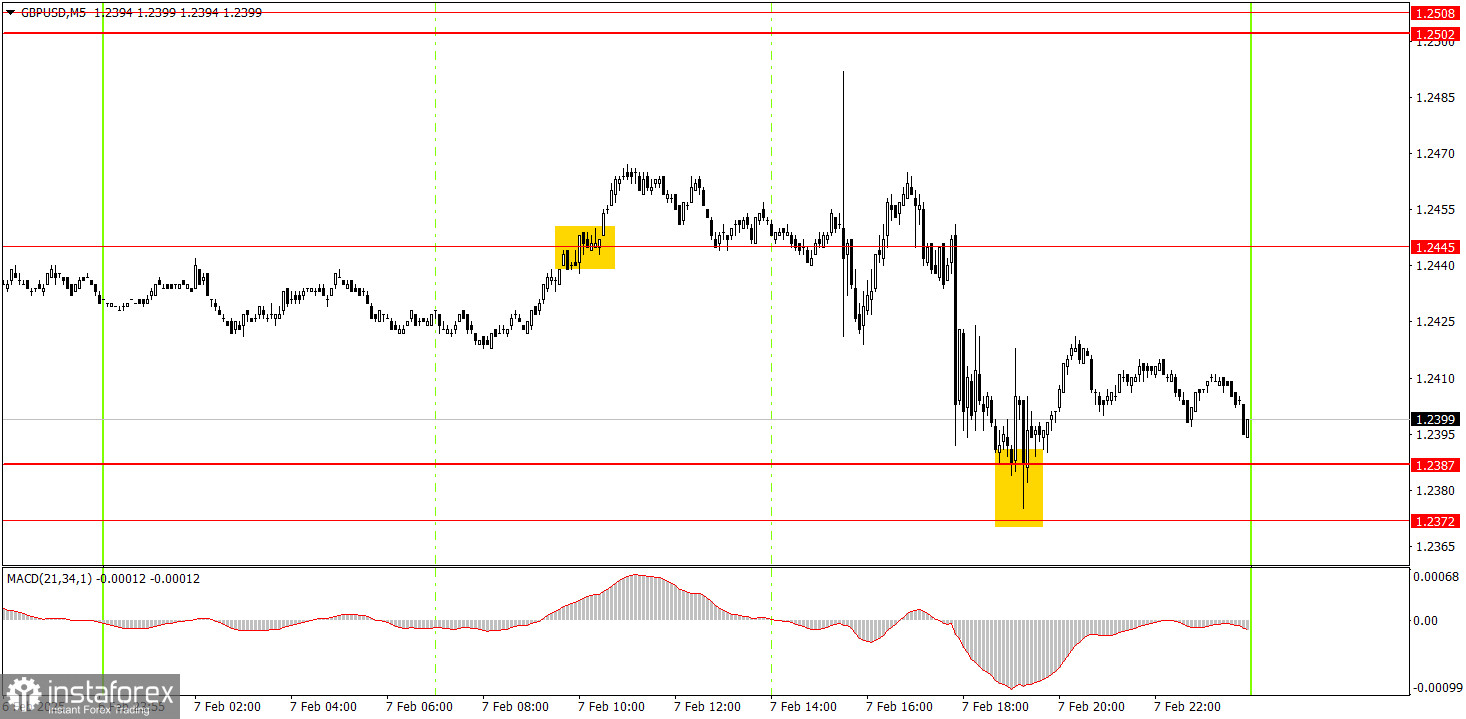
On the 5-minute chart, there were several trading signals on Friday, but only some were worth considering. During the European session, a buy signal formed around 1.2445, offering an opportunity for long positions. Before the U.S. session, traders should have either closed these positions or moved Stop Loss to breakeven.
Then, market volatility surged ("storm"), making it unwise to act on any trading signals. Later in the evening, GBP/USD rebounded from the 1.2372–1.2387 level, but this signal emerged too late in the session, making it questionable for execution.
On the hourly timeframe, GBP/USD remains in a short-term uptrend, which is effectively a corrective movement. In the medium-term, the expectation remains for a further decline toward 1.1800, as this appears to be the most logical outcome. Thus, the primary focus is waiting for the daily timeframe correction to conclude.
On Monday, GBP/USD could resume its upward movement since the price once again rebounded from the ascending trendline.
On the 5-minute TF, you can now trade by levels 1,2010, 1,2052, 1,2089-1,2107, 1,2164-1,2170, 1,2241-1,2270, 1,2301, 1,2372-1,2387, 1,2445, 1,2502-1,2508, 1,2547, 1,2633, 1,2680-1,2685, 1,2723, 1,2791-1,2798.
No major economic events are scheduled in the UK or the U.S. on Monday, meaning that the price action is likely to be technical in nature with lower volatility.
Basic Trading System Rules
Chart Explanations
Important speeches and reports (always included in the news calendar) can greatly influence the movement of a currency pair. Therefore, during their exit, it is recommended to trade as cautiously as possible or exit the market in order to avoid a sharp price reversal against the previous movement.
Those who start trading on the forex market should remember that every trade cannot be profitable. Developing a clear strategy and money management are the key to success in trading over a long period of time.
InstaForex analytical reviews will make you fully aware of market trends! Being an InstaForex client, you are provided with a large number of free services for efficient trading.


