 Permanecer
Condições de Negociações
Ferramentas


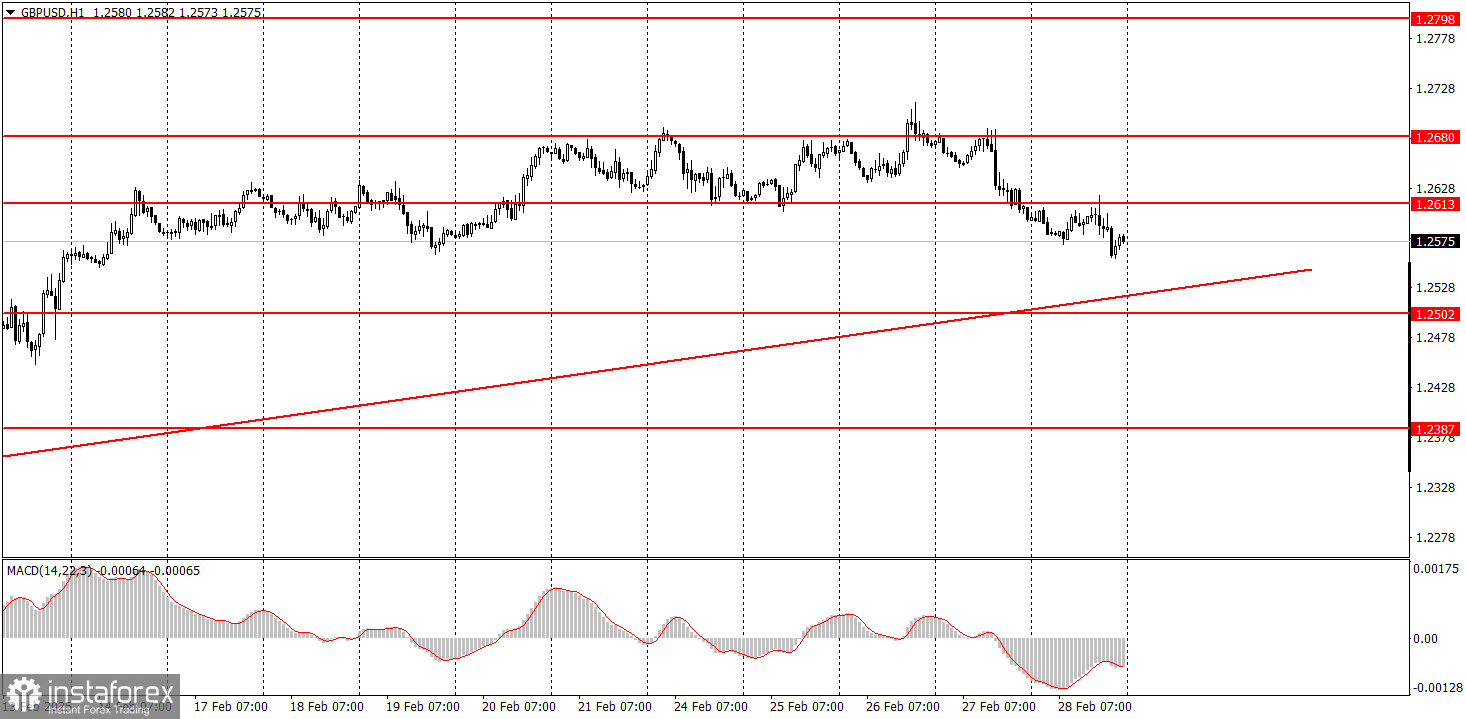
The GBP/USD pair continued its downward movement on Friday, despite the absence of significant fundamental and macroeconomic influences. The decline in the euro, driven by technical factors, also led to a fall in the British pound. In the case of the British currency, there were fewer technical justifications for this decline, as the trendline was positioned much lower than that on the euro chart. As previously noted, when the euro falls, the pound typically follows suit. The euro was unable to establish a solid upward correction, while the pound experienced a more significant correction, increasing the likelihood of a strong decline. We anticipate that the trendline will be broken next week, but the strong macroeconomic environment and events in the White House on Friday could significantly influence the US dollar on Monday. There were no noteworthy reports or events in the UK on Friday.
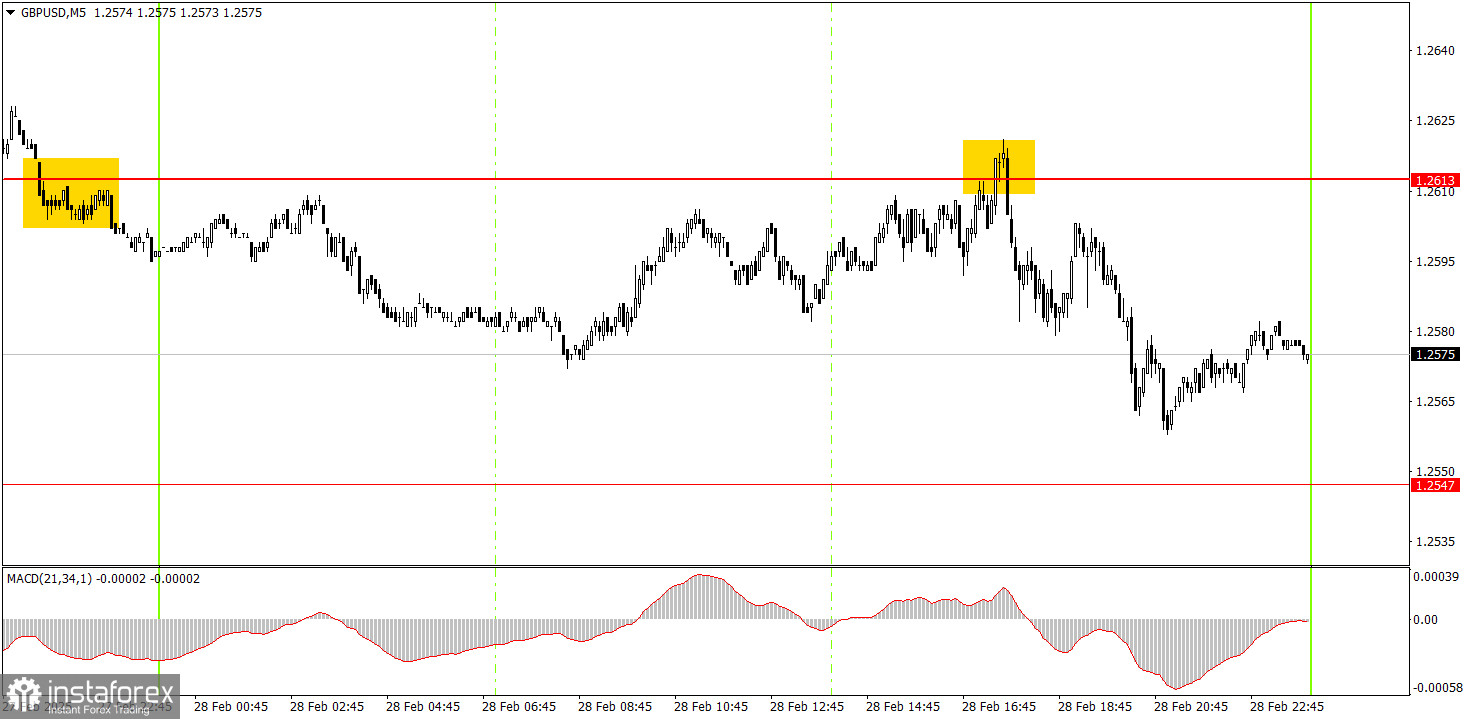
On the five-minute chart, only one trading signal was generated on Friday. During the US trading session, the price rebounded from the 1.2613 level, resulting in a drop of 45 pips. The signal appeared late in the session, but not too close to market closing, so it could have been acted upon. A stop-loss order can now be adjusted to breakeven, allowing the trade to remain open.
On the hourly chart, GBP/USD may start a short-term downtrend, but recent movements on the daily chart are merely corrections. In the medium term, we still expect the pound to fall toward 1.1800, which seems to be the most logical outcome. It is just waiting for the end of the daily timeframe's upward correction, which may have already concluded this past week.
On Monday, GBP/USD may continue its next downward leg, as the pound has strengthened significantly in recent weeks, completing the correction on the daily chart. However, the upward trendline has not yet been broken. We are almost certain it will be tested soon.
On the five-minute chart, key levels for trading on Monday are 1.2164-1.2170, 1.2241-1.2270, 1.2301, 1.2372-1.2387, 1.2445, 1.2502-1.2508, 1.2547, 1.2613, 1.2680-1.2685, 1.2723, and 1.2791-1.2798. Manufacturing sector business activity indices will be released in both the UK and the US on Monday, and they will strongly influence the pair's movements throughout the day.
Support and Resistance Levels: These are target levels for opening or closing positions and can also serve as points for placing Take Profit orders.
Red Lines: Channels or trendlines indicating the current trend and the preferred direction for trading.
MACD Indicator (14,22,3): A histogram and signal line used as a supplementary source of trading signals.
Important Events and Reports: Found in the economic calendar, these can heavily influence price movements. Exercise caution or exit the market during their release to avoid sharp reversals.
Forex trading beginners should remember that not every trade will be profitable. Developing a clear strategy and practicing proper money management are essential for long-term trading success.
InstaForex analytical reviews will make you fully aware of market trends! Being an InstaForex client, you are provided with a large number of free services for efficient trading.


