empty
 
 
Você está prestes a sair
www.instaforex.eu >
de um site operado pela
INSTANT TRADING EU LTD
Abrir Conta

02.12.202506:37 Forex Analysis & Reviews: How to Trade the EUR/USD Currency Pair on December 2? Simple Tips and Trade Analysis for Beginners

Essas informações são fornecidas a clientes profissionais e de varejo como parte da comunicação de marketing. Elas não contêm e não devem ser interpretadas como consultoria, recomendação de investimento ou uma oferta ou solicitação para se envolver em qualquer transação ou estratégia em instrumentos financeiros. O desempenho passado não é uma garantia ou previsão de desempenho futuro. A Instant Trading EU Ltd. não se responsabiliza pela exatidão ou integridade das informações fornecidas, ou por qualquer perda decorrente de qualquer investimento com base em análises, previsões ou outras informações fornecidas por um funcionário da Empresa, ou de outra forma. O termo de responsabilidade completo está disponível aqui.

Analysis of Monday's Trades:

1-Hour Chart of EUR/USD

Exchange Rates 02.12.2025 analysis

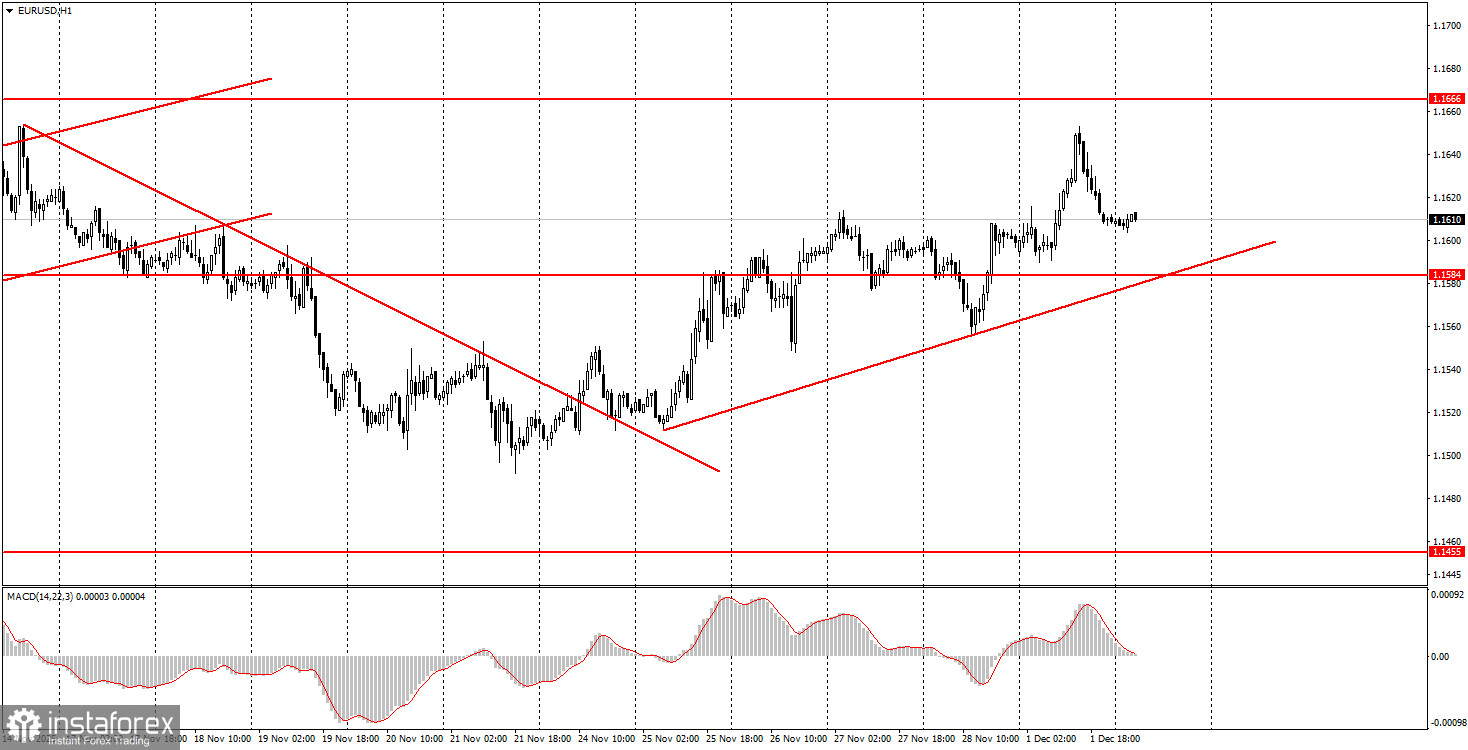
The EUR/USD currency pair maintained an upward trend on Monday and even showed quite decent movements throughout the day. These movements were not straightforward to understand, as the rise began in the first half of the day and was followed by a significant decline. The most important event of the day was the ISM manufacturing activity index, published closer to the evening. This index turned out to be worse than expected and should have triggered a decline in the U.S. dollar. However, the dollar was already falling before this index was published, and afterward it rose. This is where the illogicality lies. We assume that certain large market participants received information about the ISM index ahead of its official publication. This explains the dollar's decline in the first half of the day. Then, profit-taking began, which is why the weak ISM report actually triggered a rise in the dollar. The upward trend remains as long as the price stays above the trend line. However, a flat continues on the daily timeframe.

5-Minute Chart of EUR/USD

Exchange Rates 02.12.2025 analysis

On the 5-minute timeframe, a precise trading signal was formed on Monday. At the start of the U.S. trading session, the pair bounced off the 1.1655-1.1666 area, which allowed novice traders to open short positions. By the end of the day, the quotes had dropped by approximately 35 pips, allowing for a decent profit from the single trade.

How to Trade on Tuesday:

On the hourly timeframe, the EUR/USD pair has begun another attempt at rising. The overall fundamental and macroeconomic background remains very weak for the U.S. dollar, so the pair may still show declines only on technical grounds—the flat on the daily timeframe remains relevant. However, we expect it to conclude and for the upward trend of 2025 to resume. Market volatility remains low.

On Tuesday, novice traders can again trade from the area of 1.1571-1.1584. A bounce from this area will allow for new long positions with a target of 1.1655-1.1666. A consolidation below this area indicates short positions with targets at 1.1527-1.1531.

On the 5-minute timeframe, levels to consider include 1.1354-1.1363, 1.1413, 1.1455-1.1474, 1.1527-1.1531, 1.1571-1.1584, 1.1655-1.1666, 1.1745-1.1754, 1.1808, 1.1851, 1.1908, 1.1970-1.1988. Two macroeconomic reports are scheduled for Tuesday, both in the Eurozone. We will see the November inflation figure in the first estimate (the most important), as well as the unemployment rate. We've previously noted that inflation does not significantly impact trader sentiment at this time, but it remains an important indicator for traders.

Key Rules of the Trading System:

  1. The strength of a signal is determined by the time it takes to form the signal (bounce or breakout). The less time required, the stronger the signal.
  2. If two or more trades were opened near any level based on false signals, all subsequent signals from that level should be ignored.
  3. In a flat, any pair may form numerous false signals or none at all. At the first signs of a flat, it is better to stop trading.
  4. Trades are opened during the period between the beginning of the European session and the middle of the American session, after which all trades should be closed manually.
  5. On the hourly timeframe, it is preferred to trade only when there is good volatility and a trend confirmed by the trend line or channel, using signals from the MACD indicator.
  6. If two levels are too close to each other (5 to 20 pips), they should be viewed as a support or resistance area.
  7. Upon moving 15 pips in the right direction, set the Stop Loss to breakeven.

Chart Explanations:

  • Support and Resistance Levels: Levels that serve as targets for opening buys or sells. Take Profit levels can be placed near them.
  • Red Lines: Channels or trend lines that reflect the current trend and indicate the preferred direction for trading.
  • MACD Indicator (14, 22, 3): A histogram and signal line; a supplementary indicator that can also be used as a source of signals.

Important Note: Significant speeches and reports (always included in the news calendar) can greatly influence the movement of the currency pair. Therefore, during their release, it is advisable to trade cautiously or exit the market to avoid sharp reversals against the preceding movement.

Remember: For beginners trading in the Forex market, it is important to understand that not every trade can be profitable. Developing a clear strategy and practicing money management are keys to long-term trading success.

Paolo Greco
Analytical expert of InstaForex
© 2007-2025

Open trading account

InstaForex analytical reviews will make you fully aware of market trends! Being an InstaForex client, you are provided with a large number of free services for efficient trading.


Agora você está saindo do www.instaforex.eu, um site operado pela INSTANT TRADING EU LTD
Não pode falar agora?
Faça sua pergunta no chat.
Widget callback

Turn "Do Not Track" off