 Permanecer
Condições de Negociações
Ferramentas


The EUR/USD currency pair traded quite actively on Monday, a day with a "holiday" status. We witnessed a rise in the European currency during the European trading session. It is worth noting (as shown in the illustration below) that market activity in recent months has been minimal, if not at a historic low. We remember times when the average volatility was around 30-40 pips. Now, it stands at 50. However, we want to remind you that the pair had previously bounced off the upper line of the sideways channel 1.1430-1.1800 on the daily timeframe, so from a technical perspective, a decline was much more likely. Nevertheless, the new week began on a positive note, and we would like to remind traders of two points.
Firstly, the market is currently "thin." This means that any major transaction can shift the price by a considerable distance, since the resistance on the other side is minimal. Secondly, any flat trend will eventually come to an end. We have mentioned several times over the past months that it will end quite unexpectedly, when no one is anticipating it. Let's be frank: who expected a strong movement last week? The number of macroeconomic and fundamental events was overwhelming, yet we did not see anything particularly interesting.
However, this does not change the prospects for the US dollar. The global fundamental backdrop for it remains negative. The pair could remain in a flat for another six months, but that does not rule out the possibility that the uptrend will eventually resume. Why not during the Christmas and New Year holidays? Who in the market expects the euro to rise above 1.1800 after six months of trials? That would be the Christmas or New Year's surprise. Meanwhile, most traders, enjoying their Olivier salad or roasted turkey, will later regret missing an excellent movement.
In any case, we discussed the advisability of purchasing the European currency earlier, around the level of 1.1500. At that time, the pair was near the lower boundary of the sideways channel, and it was a buying opportunity near the lower boundary. Now that the price has reached the upper boundary, it would be logical to sell, but we want to remind you that for the euro, any decline is merely a correction. The daily timeframe clearly shows that over the last six months, the dollar has been capable of only a 23.6% correction, according to Fibonacci. Therefore, selling the pair, expecting the flat to continue for several more months, is somewhat overconfident. We still only anticipate a price increase and do not see any reason for the dollar to appreciate in 2026. The Federal Reserve will continue to ease policy one way or another, while the European Central Bank may even begin tightening its monetary policy. Donald Trump's policies are unlikely to change, and they have inflicted a devastating blow to the dollar.
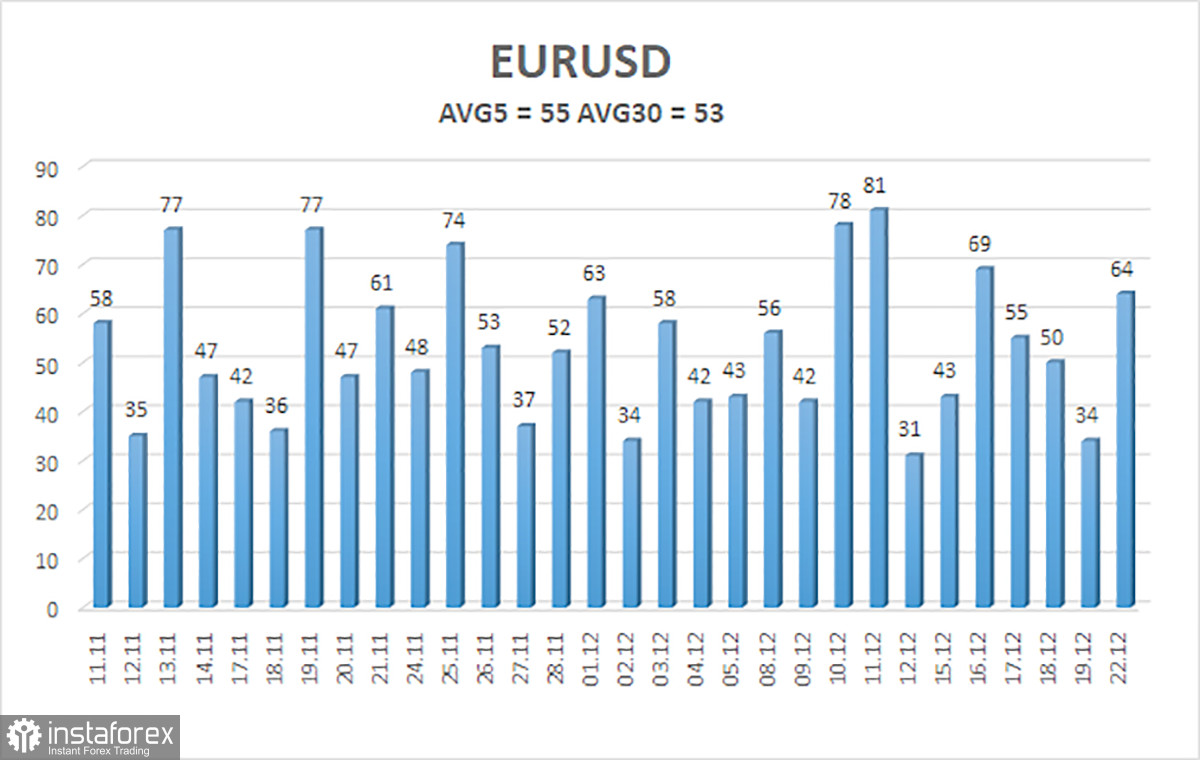
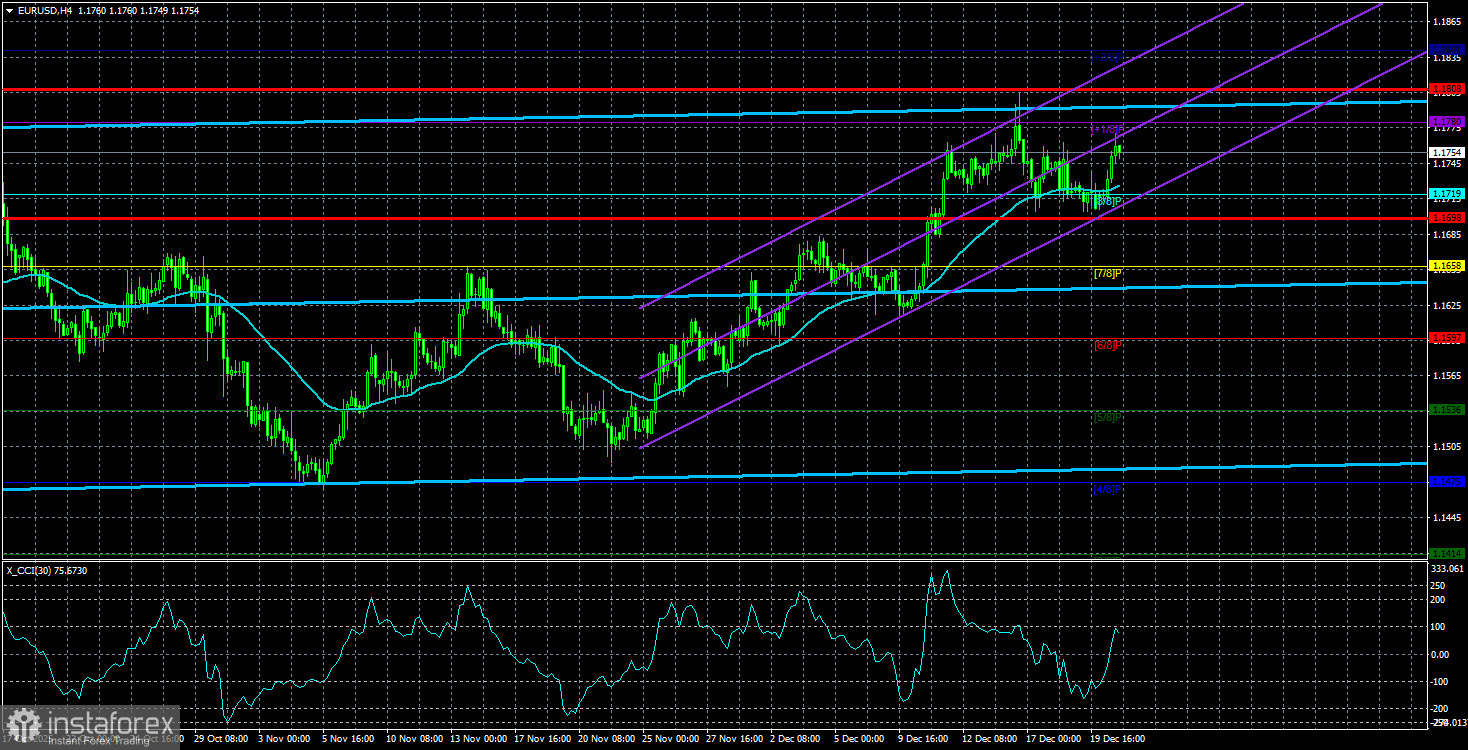
The average volatility of the EUR/USD currency pair over the last five trading days as of December 23 is 55 pips, which is considered "average." We expect the pair to trade between 1.1698 and 1.1808 on Tuesday. The upper channel of the linear regression is turning upward, but in fact, the flat trend continues on the daily timeframe. The CCI indicator entered the oversold area twice in October (!!!), but at the beginning of December, it visited the overbought area. A downward rollback is possible, which we are already observing.
S1 – 1.1719
S2 – 1.1658
S3 – 1.1597
R1 – 1.1780
R2 – 1.1841
The EUR/USD pair is positioned above the moving average line, with an upward trend maintained on all higher timeframes, while a flat trend has persisted on the daily timeframe for the sixth consecutive month. The global fundamental backdrop remains significant for the market and remains negative for the dollar. Over the last six months, the dollar has occasionally shown weak growth, but exclusively within the bounds of the sideways channel. It has no fundamental basis for long-term strengthening. When the price is below the moving average, one can consider small short positions with targets of 1.1698 and 1.1658 on purely technical grounds. Above the moving average line, long positions remain relevant with targets at 1.1808 and 1.1830 (the upper boundary of the flat on the daily timeframe), which have already been effectively reached. Now we need the flat to come to an end.
The linear regression channels help identify the current trend. If both are directed in the same way, then the trend is strong;
The moving average line (settings 20,0, smoothed) determines the short-term trend and the direction in which to trade;
Murray levels – target levels for movements and corrections;
Volatility levels (red lines) – the probable price channel in which the pair will spend the next day based on current volatility readings;
The CCI indicator – its entry into the oversold area (below -250) or the overbought area (above +250) indicates that a trend reversal in the opposite direction is imminent.
InstaForex analytical reviews will make you fully aware of market trends! Being an InstaForex client, you are provided with a large number of free services for efficient trading.


