 Permanecer
Condições de Negociações
Ferramentas


Well, Bitcoin continues to decline after a sell signal formed on the daily timeframe, which we had been waiting for about a month. Recall that during the last Bitcoin crash, only one bearish FVG was formed, from which a price reaction and a resumption of the downtrend could subsequently be expected. This FVG also served and still serves as the only POI area for sales on the daily chart. On January 15, Bitcoin, as part of a correction, worked off this pattern and has since fallen by $3,500–$4,000. Thus, traders can now only maintain open short positions.
We also spoke about a "bullish" FVG on the daily chart. Formally, this pattern is not cancelled, which means a reaction followed by a renewed correction may occur. However, again, I draw traders' attention: any buy signal is a signal for a continuation of the correction. Therefore, we are more interested in sell signals. There is another important point. On the weekly timeframe, there is also a bearish FVG that essentially coincides with the daily FVG. Nevertheless, the price reacted to it, indicating a sell signal has formed on the highest timeframe.
What are Bitcoin's decline targets? If the correction is complete, the minimum medium-term decline target is $70,800. During 2026, we allow for a much larger drop in the world's leading cryptocurrency. As for the influence of the macroeconomic and fundamental background, all markets are now in a stupor. Events in the new year are developing rapidly, and many of them are so contradictory that traders simply ignore them. We cannot conclude that Bitcoin is rising or falling because of events related to Jerome Powell or Trump's military aggression toward Latin America, Iran, or even Europe.
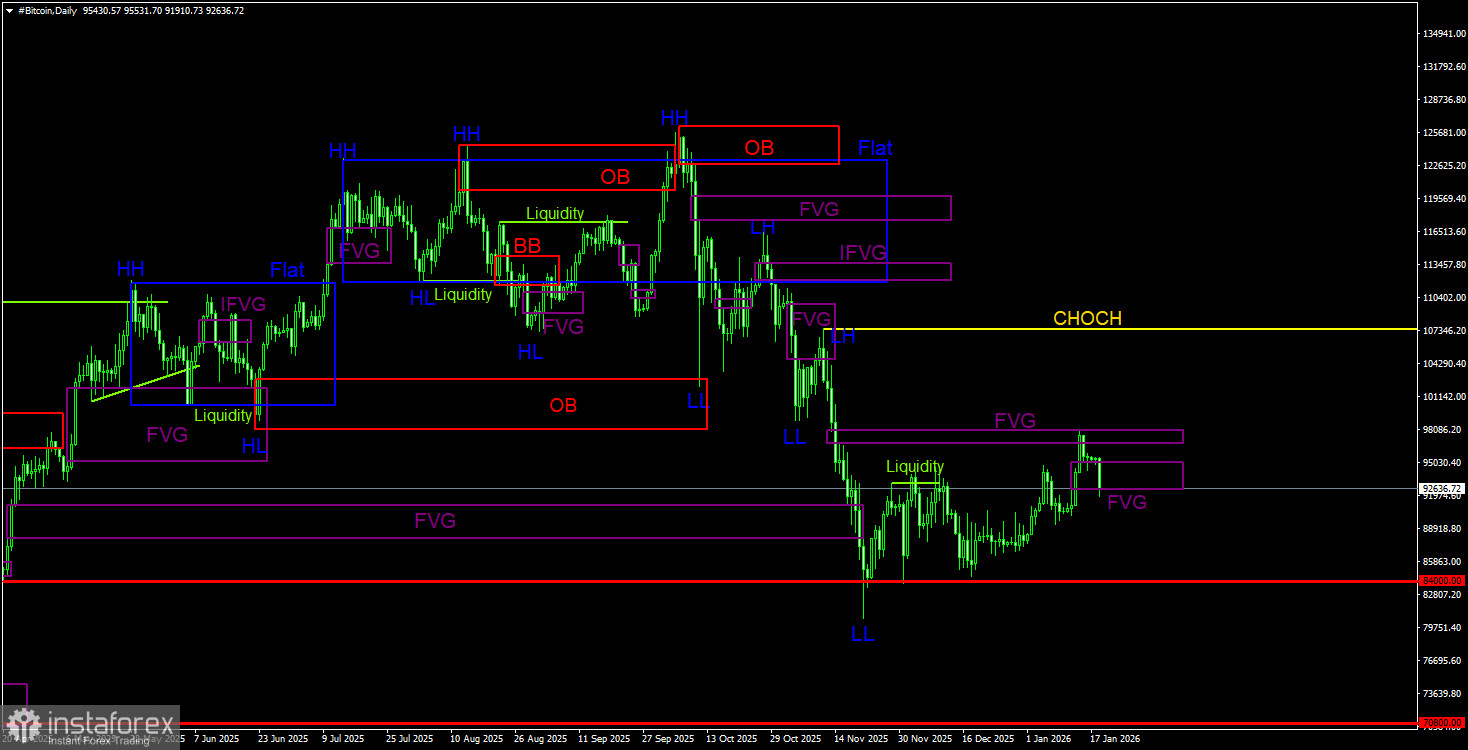
On the daily timeframe, Bitcoin continues to form a downtrend; a correction is ongoing. The trend structure is identified as downward, the June bullish OB has been worked off, the April bullish FVG has been overcome, and the $84,000 level (38.2% Fibonacci) — which we highlighted as the first target — has been reached. Further, Bitcoin can fall even to $60,000, where its last ascent began. The only POI area is the bearish FVG, which has received a reaction. A sell trading signal has formed. The target for the new leg down may be $70,800 — the 50.0% Fibonacci level. We are not taking the bullish FVG seriously for now.
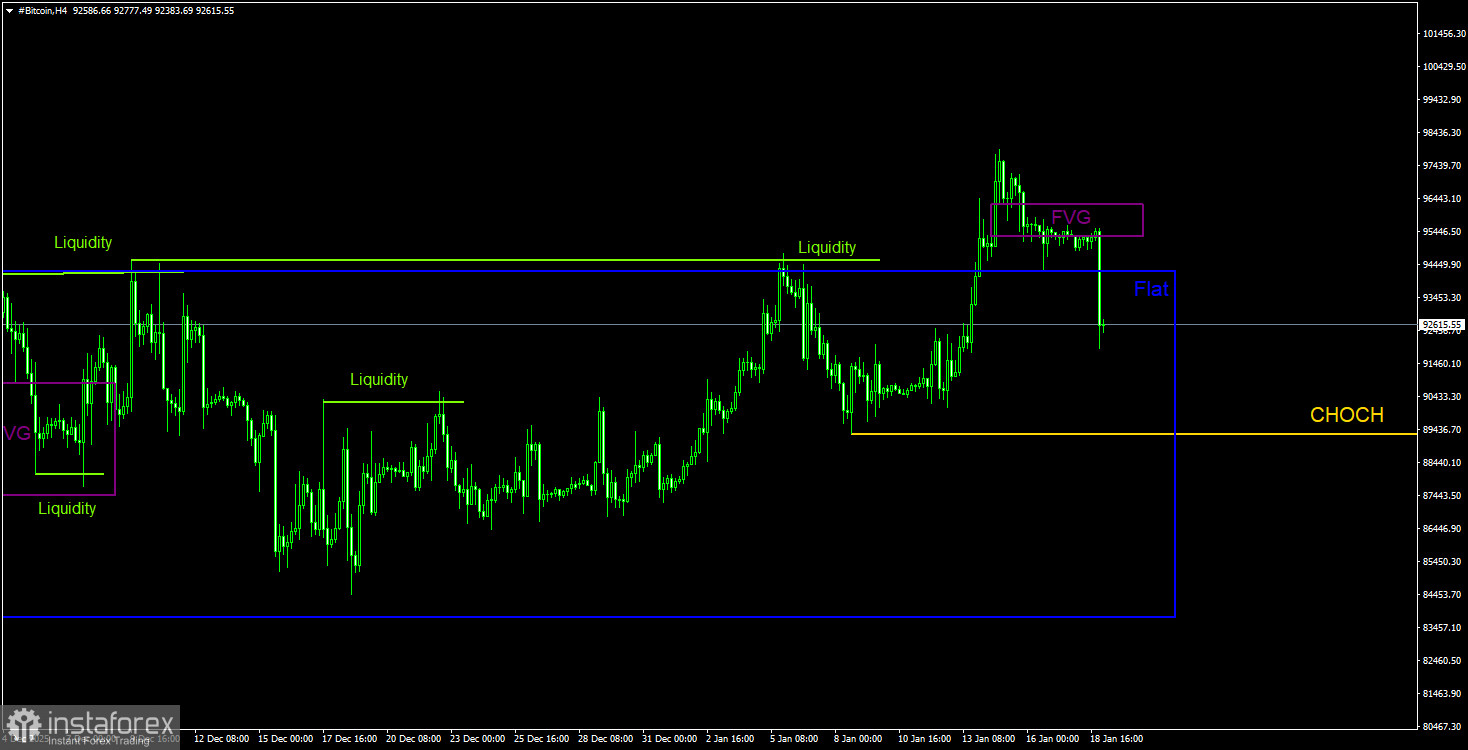
On the 4-hour timeframe, the price has left the sideways channel it spent 1.5 months in. However, Bitcoin's rise may be short-lived, as the bearish FVG on the daily timeframe has been worked off. Note that on the 4-hour timeframe, the structure is now upward, and the CHOCH line lies at $89,300. A break above this line will confirm a resumption of the primary trend. There are no bearish patterns/signals yet on the 4-hour TF. If they form, they will also confirm the daily TF signal and serve as POI areas for new short positions.
Bitcoin continues forming a full-fledged downtrend. The two nearest targets (the bullish OB in the $98,000–$102,700 area and the bullish FVG) have been worked off; now expect a fall to $70,800 (the 50.0% Fibonacci level of the three-year uptrend). Of the POI areas for selling, only the bearish FVG on the daily TF in the $96,800–$98,000 area can be highlighted. This pattern was worked off and received a price reaction. Now, a sell trade can be managed while waiting for confirmations to form across both timeframes.
CHOCH – break of trend structure.
Liquidity – liquidity; traders' stop losses that market makers use to accumulate their positions.
FVG – area of price inefficiency. Price moves very quickly through such areas, indicating a complete absence of one side in the market. Subsequently price tends to return and receive a reaction from such areas.
IFVG – inverted area of price inefficiency. After returning to such an area, the price does not receive a reaction but impulsively breaks through it and then tests it from the other side.
OB – order block. The candle on which a market maker opened a position to take liquidity and form their own position in the opposite direction.
InstaForex analytical reviews will make you fully aware of market trends! Being an InstaForex client, you are provided with a large number of free services for efficient trading.


